
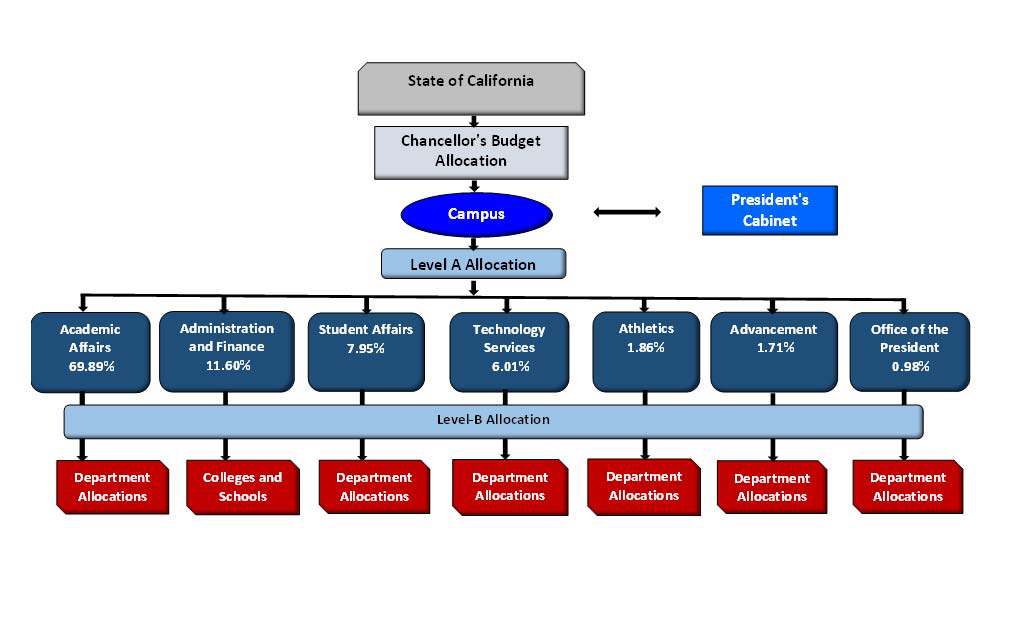
Operating Budgets
• Division budgets from Level A base funding are permanent.
• Division budgets may be incrementally adjusted annually for specific initiatives.
• New Incremental annual funding (enrollment growth) is allocated based upon Level
A percentages (net of adjustments for Centrally Managed Funds).
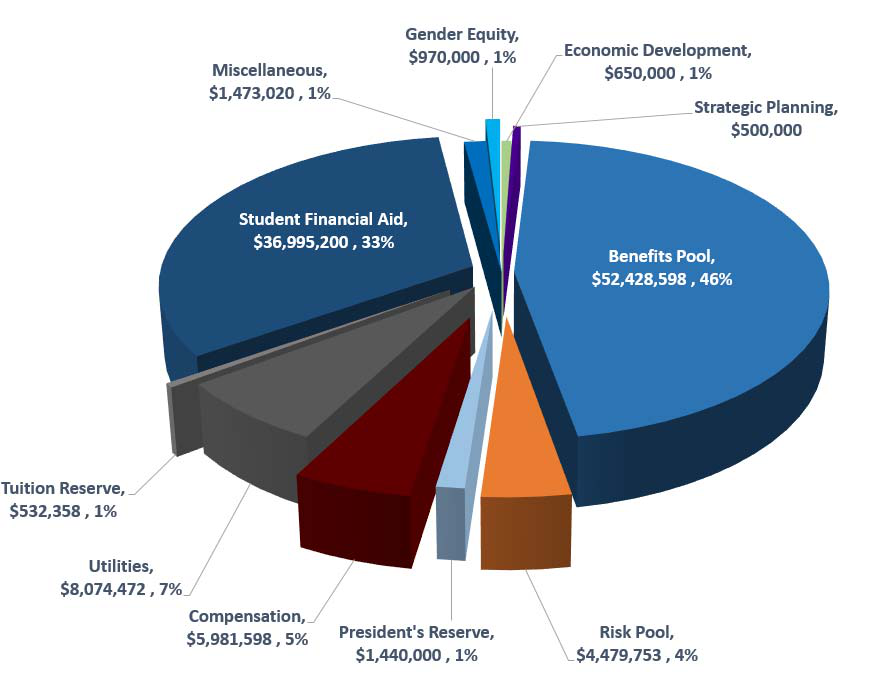
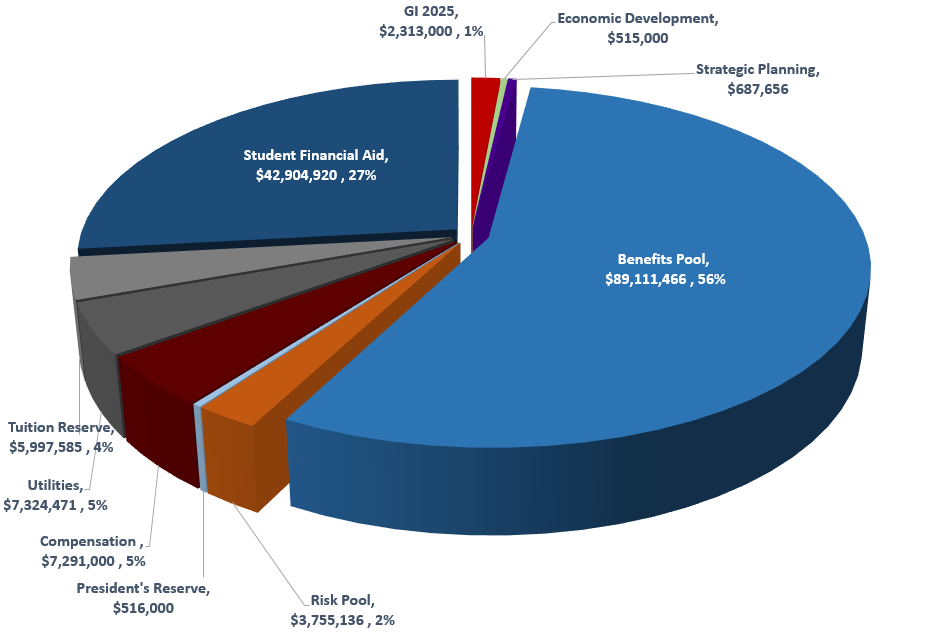
Centrally Managed Funds
Benefits Pool
Compensation Pool
Risk Pool
Utilities
President’s Reserve
Tuition Reserve
Strategic Plan
Graduation Initiative 2025
Student University Grants (SUG)
Campus Allocations
2019-20 Budget CSU Fresno
CSU Fresno
2018-19 Final Budget $3,627,143,000 $164,229,432
2018-19 State Funded
Retirement Adjustment $22,502,000 $1,017,000
2018-19 Revised General
Fund Base $3,649,645,000 $165,246,432
2019-20 General Fund
Increase $332,907,000 $17,790,600
2019-20 Total General
Fund Budget $3,982,552,000 $183,037,032
2018-19 Final Budget
Gross Tuition & Fees $3,118,104,000 $143,416,000
2019-20 Projected Tuition
from 2.75 enrollment growth $46,158,000 $2,787,000
2019-20 Gross Tuition
& Fees $3,164,262,000 $146,203,000
2019-20 Operating Budget $329,240,032
Health Center Fee ($3,463,000)
2019-20 Total Operating
Budget $7,146,814,000 $325,777,032
2019-20 Projected Expenditure Increases
Graduation Initiative 2025 $45,000,000 $2,313,000
Enrollment Funding (2.75%) $131,158,000 $6,906,000
Average Unit Load Increase $351,000
Employee Compensation $147,831,000 $7,291,000
Mandatory Costs
Employer-paid Health Care
and Dental Premium $7,304,000 $388,000
Operations & Maintenance
of New Facilities $4,748,000 $64,000
Retirement above State
Funding $23,198,000 $1,518,000
Minimum Wage Increase $7,022,000 $528,000
Project Rebound $3,300,000
Rapid Housing for Homeless
& Housing Insecure Students $6,500,000
Other Program Adjustments $3,004,000
Total 2019-20 Projected
Expenditure Increases $379,065,000 $19,359,000
State University Grant
2018-19 Campus Base $41,345,100
2019-20 Increase $1,218,600
2019-20 Total State
University Grants $42,563,700
2019-20 New Campus Funding
• Permanent enrollment growth funding = $6,906,000.
– $4,406,000 = Level A
– $2,500,000 = Benefit Pool
• GI 2025 permanent = $2,313,000 (Academic Affairs, Student
Affairs, Benefits)
• GI 2025 one time = $1,577,000 (Academic Affairs)
• Cost of instruction
Tuition and fees = $4,569 per FTE
General Fund = $6,753 per FTE
TOTAL = $11,322 per FTE
2019-20 Level A General Fund Increase
Division Amount Percent
Academic Affairs $3,079,353 69.89%
Administration & Finance $511,096 11.60%
Student Affairs & Enrollment
Management $350,276 7.95%
Advancement $75,343 1.71%
Athletics $81,952 1.86%
Technology Services $264,801 6.01%
Office of the President $43,179 0.98%
TOTAL $4,406,000 100.00%
Level A Overview Academic Affairs
1. $700,000 allocated after Level A was finalized
2. $1,400,000 = $700,000 in 2018-19 and $700,000 in 2019-20.
Funding was made permanent in 2019-20
3. Includes $351,000 for Average Load Increase
4. Does not include $1,577,000 of one-time GI 2025
2014-15 2015-16 2016-17 2017-18 2018-19 2019-20
Level A Level A Level A Level A Level
A Level A
Allocation Allocation Allocation Allocation Allocation
Allocation
Prior Year Level A 78,197,156 81,720,043 89,487,778 97,039,026 101,620,042
103,952,872
Comp Increase
Adj PY 1,336,120 2,396,900 351,398 93,331 559,935
742,904
Equity Increase 1,119,489 491,411
Risk Pool
Assessment (PY) 541,005 425,214 453,384 383,204 358,781
363,409
GI 2025 Funding 60,000 1,134,100 1,810,298 2,200,000
Restoration
Benefit Pool 43,746
Campus Adjustments 457,452 315,000 769,605 285,000 54,544
Compensation
Augmentation 4,734,554 2,367,964 1,722,979 3,439,617
New Level A Funding 1,509,778 3,964,516 3,430,353
Risk Pool
Assessment (425,214) (453,384) (383,204) (358,781) (363,409) (425,457)
Total 81,720,043 89,487,778 97,039,026 101,620,042 103,952,872 113,703,698
Total Level A 123,215,239 134,821,034 144,295,546 151,958,176 157,276,451 171,705,993
Total % of Level A Allocation
excluding centrally
managed funds 66.32% 66.38% 67.25% 66.87%
66.10% 66.22%
Level A Overview Administration & Finance
2014-15 2015-16 2016-17 2017-18 2018-19
2019-20
Level A Level A Level A Level A Level
A Level A
Allocation Allocation Allocation Allocation Allocation
Allocation
Prior Year Level A 14,832,914 15,528,260 16,617,016 17,388,798 17,800,792
18,614,927
Comp Increase
Adj PY 179,354 436,308 242,192 70,296 428,069
114,276
Equity Increase 40,158 54,595
Risk Pool
Assessment (PY) 569,968 760,241 818,961 892,711 903,802 858,685
New Space 426,000 13,000 10,000 55,000 64,000
Restoration
Benefit Pool 29,981
Campus Adjustments 83,000 70,000 60,000
Compensation
Augmentation 538,744 214,788 270,948 318,732
New Level A Funding 250,585 658,011 511,096
Risk Pool
Assessment (760,242) (818,962) (892,710) (903,802) (858,684)
(959,397)
Total 15,528,560 16,617,016 17,388,798 17,800,791 18,614,927 19,582,319
Total Level A 123,215,239 134,821,034 144,295,546 151,958,176 157,276,451 171,705,993
Total % of Level A Allocation
excluding centrally
managed funds 12.60% 12.33% 12.05% 11.71%
11.84% 11.40%
Level A Overview Student Affairs & Enrollment Management
2014-15 2015-16 2016-17 2017-18 2018-19
2019-20
Level A Level A Level A Level A Level
A Level A
Allocation Allocation Allocation Allocation Allocation
Allocation
Prior Year Level A 8,724,467 9,072,686 9,755,382 10,802,566 12,801,882
13,257,863
Comp Increase
Adj PY 181,704 211,132 150,646 31,556 248,322 54,375
Equity Increase 42,444 74,874
Risk Pool
Assessment (PY) 134,787 151,620 173,464 156,313 147,890 157,897
GI 2025 Funding 438,400 376,400 1,832,377 1,520,000
Restoration
Benefit Pool 30,663
Campus Adjustments (457,452) 251,525
Compensation
Augmentation 176,588 126,960 217,666 221,940
New Level A Funding 171,737 450,964 350,276
Risk Pool
Assessment (151,620) (173,464) (156,313) (147,890) (157,897)
(124,254)
Total 9,072,686 9,755,382 10,802,566 12,801,882 13,257,863 15,438,097
Total Level A 123,215,239 134,821,034 144,295,546 151,958,176 157,276,451 171,705,993
Total % of Level A Allocation
excluding centrally
managed funds 7.36% 7.24% 7.49% 8.42%
8.43% 8.99%
1. $560,000 allocated after Level A was finalized
2. $1,120,000 = $560,000 in 2018-19 and $560,000 in 2019-20.
Funding was made permanent in 2019-20.
Level A Overview Technology Services
2014-15 2015-16 2016-17 2017-18 2018-19
2019-20
Level A Level A Level A Level A Level
A Level A
Allocation Allocation Allocation Allocation Allocation
Allocation
Prior Year Level A 7,532,366 7,755,601 8,660,161 8,687,377 9,228,494
9,683,253
Comp Increase
Adj PY 61,445 139,020 102,756 17,244 186,422
21,744
Equity Increase 36,180 48,223
Risk Pool
Assessment (PY) 13,095 9,964 5,088 3,746 6,520 7,479
GI 2025 Funding 272,640 209,655 280,000
Restoration
Benefit Pool 28,829
Campus Adjustments 383,566 (550,081) 206,196 80,000
Compensation
Augmentation 152,336 110,796 189,296 197,059
New Level A Funding 129,830 340,918 264,801
Risk Pool
Assessment (9,964) (5,088) (3,746) (6,520) (7,479)
(8,909)
Total 7,755,601 8,660,161 8,687,377 9,228,494 9,683,253 10,445,427
Total Level A 123,215,239 134,821,034 144,295,546 151,958,176 157,276,451 171,705,993
Total % of Level A Allocation
excluding centrally
managed funds 6.29% 6.42% 6.02% 6.07%
6.16% 6.08%
1. $140,000 allocated after Level A was finalized
2. $280,000 = $140,000 in 2018-19 and $140,000 in 2019-20.
Funding was made permanent in 2019-20.
Level A Overview Athletics
2014-15 2015-16 2016-17 2017-18 2018-19
2019-20
Level A Level A Level A Level A Level
A Level A
Allocation Allocation Allocation Allocation Allocation
Allocation
Prior Year Level A 3,430,049 3,970,354 4,472,890 4,645,609 4,765,455 5,812,772
Comp Increase
Adj PY 39,018 100,624 47,880 57,696 78,456
137,660
Equity Increase 1,992
Risk Pool
Assessment (PY) 2,535 1,248 1,328 2,205 10,342
14,949
Campus Adjustments 970,000 -
Compensation
Augmentation 125,716 70,287 3,468 89,088
New Level A 500,000 400,000 81,952
Risk Pool
Assessment (1,248) (1,328) (2,205) (10,342) (14,949)
(16,123)
Total 3,970,354 4,472,890 4,645,609 4,765,455 5,812,772 6,120,298
Total Level A 123,215,239 134,821,034 144,295,546 151,958,176 157,276,451 171,705,993
Total % of Level A Allocation
excluding centrally
managed funds 3.22% 3.32% 3.22% 3.14%
3.70% 3.56%
Level A Overview Advancement
2014-15 2015-16 2016-17 2017-18 2018-19
2019-20
Level A Level A Level A Level A Level
A Level A
Allocation Allocation Allocation Allocation Allocation
Allocation
Prior Year Level A 3,395,667 4,046,801 4,393,787 4,287,425 4,280,855
4,470,451
Comp Increase
Adj PY 39,318 74,064 62,528 39,648 101,322
73,728
Equity Increase 13,812 15,126
Risk Pool
Assessment (PY) 22,496 27,218 18,108 26,696 37,539
51,993
Restoration
Benefit Pool 116,538
Campus Adjustments (214,524) (56,196) 50,000 200,000
Compensation
Augmentation 39,096 20,821 52,728 51,540
New Level A 500,000 250,000 75,343
Risk Pool
Assessment (27,218) (18,108) (26,696) (37,539) (51,993)
(59,582)
Total 4,046,801 4,393,787 4,287,425 4,280,855 4,470,451 4,863,473
Total Level A 123,215,239 134,821,034 144,295,546 151,958,176 157,276,451 171,705,993
Total % of Level A Allocation
excluding centrally
managed funds 3.28% 3.26% 2.97% 2.82%
2.84% 2.83%
Level A Overview Office of the President
2014-15 2015-16 2016-17 2017-18 2018-19
2019-20
Level A Level A Level A Level A Level
A Level A
Allocation Allocation Allocation Allocation Allocation
Allocation
Prior Year Level A 947,800 1,121,493 1,434,068 1,444,744 1,460,656
1,484,314
Comp Increase
Adj PY 2,523 6,984 8,264 14,196 20,790
22,236
Equity Increase
Adjustment
Campus Adjustments 150,000 250,000
Compensation
Augmentation 2,412 1,716 2,868 2,952
New Level A Funding 21,170 55,591 43,179
Risk Pool
Assessment -
Total 1,121,493 1,434,068 1,444,744 1,460,656 1,484,314 1,552,681
Total Level A 123,215,239 134,821,034 144,295,546 151,958,176 157,276,451 171,705,993
Total % of Level A Allocation
excluding centrally
managed funds 0.91% 1.06% 1.00% 0.96%
0.94% 0.90%
Employees Incremental New Hires - Staff and MPPs
2014/15 2015/16 2016/17 2017/18 Fall 2018
53 114 50 21 3
Employees by Employment Group (November 1, 2018)
Fall 2014 Fall 2015 Fall 2016 Fall 2017 Fall
2018
# % # % # % # % #
%
Manager 148 6.6% 174 7.5% 168 6.9% 162 6.3% 168
6.5%
Staff 736 32.8% 767 32.9% 816 33.4% 867 33.8% 886
34.1%
Tenure/
Tenure
Track
Faculty 567 25.3% 564 24.2% 597 24.4% 635 24.7% 653 25.2%
Non-Tenure
Track
Faculty 794 35.4% 829 35.5% 863 35.3% 903 35.2% 889
34.2%
Total All
University 2,245 100.0% 2,334 100.0% 2,444 100.0% 2,567 100.0% 2,596
100.0%
Employees are categorized based on their primary employment status.
Includes all instructional faculty, coaches, librarians, academic-related service professionals and grant-related faculty.
Data is based on headcount.
Source: Office of Institutional Effectiveness and Human Resources
2019-20 Facility Modernization Projects
Project Title Total Project Cost
Resnick Student Union $60,000,000
Ruiz Executive Classroom Building $4,050,000
Modernization of Science Laboratories - Phase II $1,500,000
Programs for Children Expansion (ED-10 & FFS-130) $300,000
Subtotal: $65,850,000
2019-20 Systemwide Deferred Maintenance
NS Gym Fire Sprinkler Upgrade - Phase 2
(SFM MOU) $2,500,000
New Domestic Well #7 & SCADA $3,200,000
Sewer Improvements - Phase 4 $1,500,000
Campus Fire Alarm System Replacement $3,600,000
HVAC Improvements $34,500,000
Subtotal: $45,300,000
Estimated Total: $111,150,000
This HTML version was generated with AI assistance and may contain errors or omissions. The original approved PDF remains the official document of record. An alternative accessible format is available upon request from the document creator in accordance with Title II of the ADA.