Report of the Task Force on Tenure Density in the California State University_2018_Statewide Senate
THE CALIFORNIA STATE UNIVERSITY
OFFICE OF THE CHANCELLOR
BAKERSFIELD
CHANNEL ISLANDS
CHICO
DOMINGUEZ HILLS
EAST BAY
FRESNO
FULLERTON
HUMBOLDT
LONG BEACH
LOS ANGELES
MARITIME ACADEMY
MONTEREY BAY
NORTHRIDGE
POMONA
SACRAMENTO
SAN BERNARDINO
SAN DIEGO
SAN FRANCISCO
SAN JOSÉ
SAN LUIS OBISPO
SAN MARCOS
SONOMA
STANISLAUS
401 GOLDEN SHORE • LONG BEACH, CALIFORNIA 90802-4210 • (562) 951-4700 • Fax (562)
951-4986
March 16, 2018
To The California State University Community:
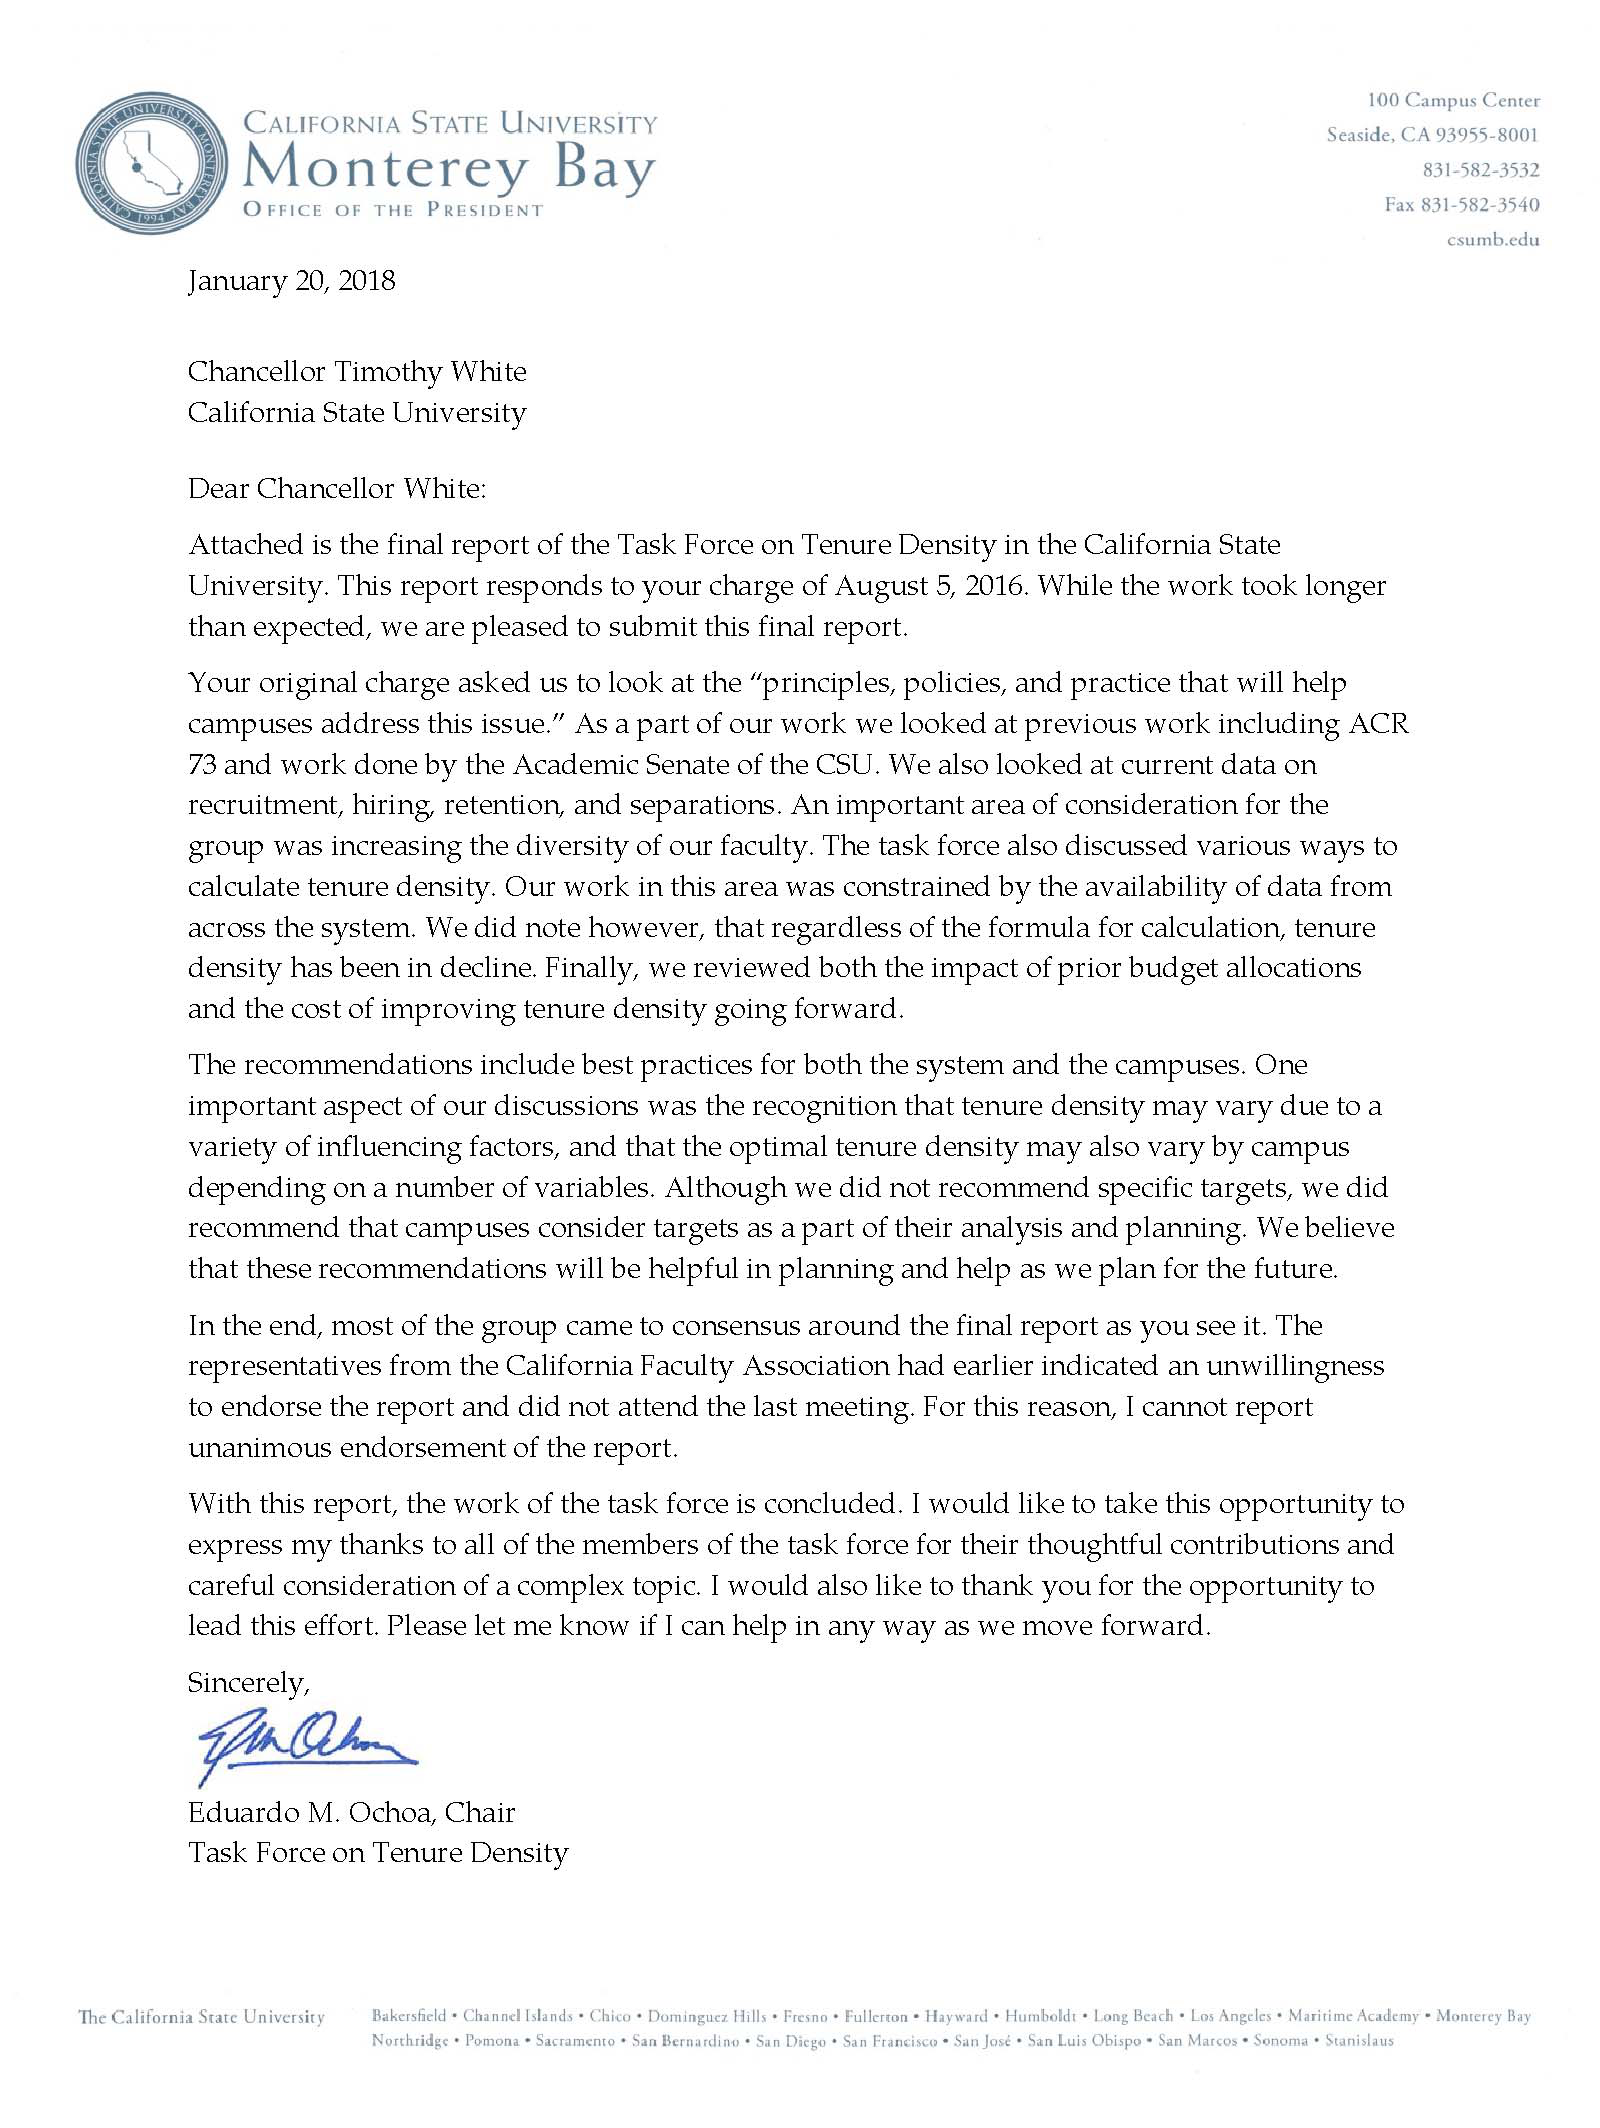
On January 20, 2018, I received the Report of the Task Force on Tenure Density in
the California State University. I have reviewed and accept the report, which is appended
to this letter along with the cover letter from California State University, Monterey
Bay President Eduardo Ochoa, who chaired the task force. On behalf of the CSU, I thank
President Ochoa along with the 12 task force members – comprised of faculty and administrators
– for their thoughtful and comprehensive effort.
In the charge (page 16) I asked the task force to: (1) review data, (2) develop best
practices to be shared with campuses, and (3) identify principles to guide campuses
going forward. The report provides a helpful overview of tenure-density trends in
the system, draws attention to the complex and campus-specific considerations required
to develop a tenure density plan, and provides a sobering analysis of the large financial
requirements to make progress toward improved tenure density.
This Report recognizes that inadequate tenure density may adversely affect educational
quality, and yet establishing adequate tenure density will vary by campus – and by
extension, academic units within a campus – depending on a number of factors. Indeed,
the Report clearly recognizes that each campus will have its own considerations in
planning and hiring; one size does not fit all. I am now asking campus leadership,
senates and faculty to engage in a discussion of this report and its recommendations.
I also ask that campuses implement, as appropriate, specific recommendations to strengthen
the institution, while acknowledging that implementing recommendations will require
innovation and must take into account the realities of available resources.
The report contains five administrative recommendations (page 15) for my consideration
as Chancellor. The first four system recommendations have been referred to Vice Chancellor
for Human Resources Melissa Bard and Executive Vice Chancellor for Academic and Student
Affairs Loren Blanchard for further consideration, including establishing a standard
definition for tenure density, developing a new metric for the number of students
(FTES) to tenure-track faculty (FTEF) ratio, establishing a process for reporting
systemwide and campus metrics, and disseminating data on an annual basis.
The final system recommendation – to lobby the legislature and governor for more state
funding, in collaboration with CFA, ASCSU, faculty, and students – is well under way
for this budget cycle as it is every year, under the leadership of Vice Chancellor
for University Relations and Advancement Garrett Ashley and Executive Vice Chancellor
for Business and Finance Steve Relyea.
Although the California Faculty Association members of the task force are not signatories
to the final document, it is my understanding that they share our interest in tenure
density. I thank them for their contribution to the discussions.
Sincerely,
Timothy P. White
Chancellor


REPORT OF THE TASK FORCE
ON TENURE DENSITY IN THE
CALIFORNIA STATE UNIVERSITY
JANUARY 19, 2018
CSU OFFICE OF THE CHANCELLOR
1
Members of the Task Force on Tenure Density
Dr. Eduardo M. Ochoa, Chair, President, CSU Monterey Bay
Dr. Sylvia Alva, Provost, Cal Poly Pomona
Dr. Lynnette Zelezny, Provost, CSU Fresno
Dr. Clare Weber, Deputy Provost and Vice Provost for Academic Programs, CSU San Bernardino
Dr. Simone Aloisio, Senator, CSU Channel Islands
Dr. Jerry Schutte, Senator, CSU Northridge
Dr. Diana Guerin, Academic Senate CSU - Designee, CSU Fullerton
Dr. Jennifer Eagan, CFA President, CSU East Bay
Dr. Jonathan Karpf, CFA Associate Vice President, San José State
Dr. Kevin Wehr, CFA Associate Vice President, CSU Sacramento
Dr. Christine Mallon, Assistant Vice Chancellor, Office of the Chancellor
Dr. Margaret Merryfield, Assistant Vice Chancellor, Office of the Chancellor
Mr. John Swarbrick, Associate Vice Chancellor, Office of the Chancellor
2
Over the last 20 years the number of undergraduates enrolled in universities has increased,
while the percent of tenure/tenure-track faculty teaching them has declined. A national
report notes a steady shift in the academic work force and a decline in tenure density.1
These declines have an impact across the university. Tenured and tenure-track faculty
play important roles in shared governance, the creation and ongoing development of
curriculum and programs, professional development, administrative functions, service
to the university in areas such as search committees and planning groups, and engagement
in the life of the campus. During the last 10 years, the tenure density in the California
State University (CSU) has also declined. Although the trend began earlier than 2007,
since that year, 21 of 23 campuses saw declines in the proportion of their faculty
on the tenure-track. Four campuses saw declines of more than 10 percent over that
time. Taken as a whole, tenure density in the CSU system declined by more than five
percent. Today, only 10 campuses have tenure density of more than 60 percent.
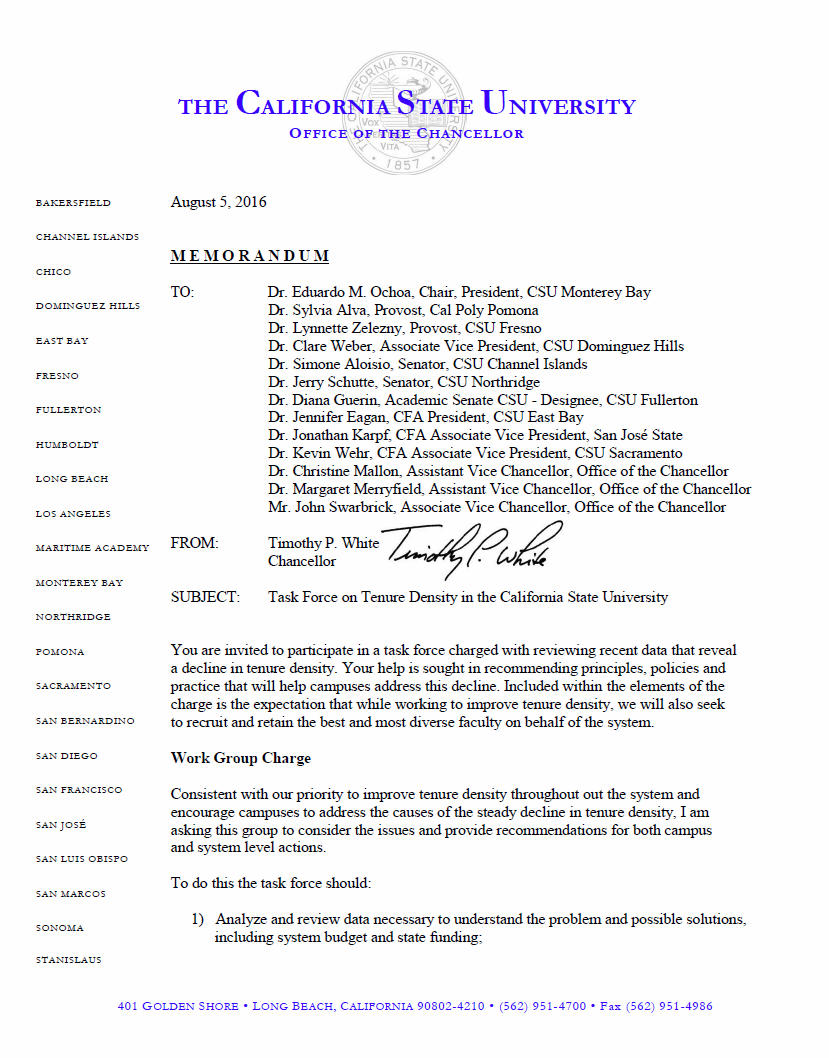
In response to these declines and at the request of the Academic Senate of the California
State University (ASCSU), on August 5, 2016, Chancellor Timothy P. White established
a task force to examine tenure density in the CSU. The charge asked that the group
review data surrounding tenure density in order to understand the issue and to make
recommendations on best practices and principles to guide campuses in their efforts
to improve tenure density (Attachment 1). As reflected in a report to presidents,
increasing the ranks of our tenure-track faculty “represents a major opportunity to
recruit talented, diverse faculty who are committed to serving the CSU’s diverse population
and to using their knowledge and skills to continue to improve graduation rates and
reduce achievement gaps.”2 Task force membership was drawn from faculty and administration
both from campuses and the Chancellor’s Office (Attachment 1). The task force benefited
from the various perspectives represented in the discussions.
The Chancellor requested that the task force recommend “principles, policies and practice
that will help campuses address this decline,” with the expectation that the CSU will
“recruit and retain the best and most diverse faculty on behalf of the system.” The
task force has followed this guidance, and the report ends with suggested best practices,
principles for addressing the issue, and recommendations for the system and the campuses.
One aspect of tenure density that was not included in the charge, but nevertheless
was the subject of discussion, was setting a target for tenure density. In 2001, California
State Assembly Concurrent Resolution 73 (ACR 73) Strom-Martin set a target of 75 percent
to be achieved over eight years between 2002 and 2010 (see below). Most members saw
the work of the task force as an opportunity to consider what ideal tenure density
might be and what factors might influence the establishment of that ideal. These factors
included department size, number of majors, whether there was a graduate program,
and the number of lower-division service courses among others. While most agreed with
the above considerations, some members believed that improvement in tenure density
required the setting of targets and tracking of progress.
In carrying out its work, the task force reviewed CSU System data, Chancellor’s Office
reports, resolutions and reports from the ASCSU, legislative resolutions on the subject
and reports prepared by previous CSU work groups. Specific data on diversity were
also provided to the group. Data on student enrollment and changes in faculty hiring
were requested and provided. Data reviewed by the task force are included in or attached
to this report. In addition, the group engaged in a discussion of the roles and responsibilities
of tenured and probationary faculty. The task force held its first meeting September
19, 2016, and its work was accomplished in the course of in-person meetings and virtual
meetings over the next several months.
1 Hurlburt, Steven and Michael McGarrah, “The Shifting Academic Workforce: Where are
the Contingent Faculty?”, TIAA Institute and Delta Cost Project, 2016. 2 Merryfield,
Margaret, Michael Caldwell, “Faculty Recruitment in the CSU,” April, 2016.
3
I. Background
The CSU strategic plan, Access to Excellence, issued in 2008, recognized the importance
of faculty as a “strategic asset” to the university. At the same time, the report
acknowledged that the “pattern across American higher education and within the CSU
in the last decade has been to shift reliance for instruction onto non-tenure-track
faculty.”3 These trends in tenure density have attracted attention from the ASCSU,
and we include here a list of related ASCSU resolutions and reports since 2000. The
statewide academic senate has consistently drawn attention to the importance of the
recruitment, hiring and retention of faculty (Attachment 2).
The role of tenure track faculty in student success has received national scholarly
attention as well. Jaeger and Eagan found that a higher proportion of contingent faculty
has a negative impact on student persistence.4 In a study using Higher Education Research
Institute (HERI) data gathered from a wide range of institutions, Umbach found “that
all faculty members’ commitment to teaching, regardless of appointment type, drops
as the proportion of part-time faculty increases.”5 A broad range of factors such
as financial aid status and preparation levels can influence graduation rates. In
their study Ehrenberg and Zhang indicated that “our estimates suggest that other factors
held constant, increases in either the percentage of faculty that are part-time or
the percentage of full-time faculty that are not on tenure tracks, each is associated
with a reduction in graduation rates.”6 Based on the above research findings, the
task force suggests that improved tenure density will have a positive impact on teaching,
persistence and graduation.
In 2001 the California Legislature passed ACR 73, calling for a plan to increase tenure
density to 75 percent.7 ACR 73 was a non-binding resolution, but in response the CSU,
the ASCSU, and the California Faculty Association (CFA) in July of 2002, issued A
Plan to Increase the Percentage of Tenured and Tenure-Track Faculty in the California
State University.8 In fall 2002 the CSU Board of Trustees’ budget included a request
for $35.6 million to begin incremental implementation of that plan in the 2003-04
academic year. The request was not funded, and the same request of $35.6 million was
included in the 2004-05 trustees’ budget request. The amount requested increased over
the years, and in 2009-10 the request was $42 million. In the seven years that the
request was included in the trustees’ budget, it was never funded. After seven unsuccessful
requests, funding was no longer included in CSU Trustees’ budget request beginning
with the 2010-11 budget cycle.9
Although the resulting plan was never fully realized, the 2002 report highlights the
importance of a strong foundation of tenured and tenure-track faculty to the success
of the institution. Recognition of the need for tenured faculty in the CSU has once
again become evident in the legislative arena. AB 1464, introduced on February 17,
2017, by Assembly Member Shirley Weber, called on the CSU to increase the percentage
of tenured and tenure-track faculty and to improve faculty diversity, but the bill
was not enacted.
3 http://www.calstate.edu/accesstoexcellence/challenges.shtml
4 Jaeger, Audrey J., and M. Kevin Eagan, “Examining Retention and Contingent Faculty
Use in a State System of Higher Education,” Education Policy, 2011, 528.
5 Paul D. Umbach, ”The effects of part-time faculty appointments on instructional
techniques and commitment to teaching,” present at the Annual Conference of the Association
for the Study of Higher Education, 2008, 15. In this study commitment to teaching
is measured by time preparing for class and time spent advising students
6 Ehrenberg, Ronald G. and Liang Zhang, “Do Tenured and Tenure-Track Faculty Matter?”,
NBER, 2004, 6-7. 7 http://www.calstate.edu/AcadSen/Records/Reports/ACR73_07222002.pdf 8 http://www.calstate.edu/AcadSen/Records/Reports/ACR73_07222002.pdf
9 http://www.calstate.edu/budget/fybudget/support-budgets/documents/2003-04-Support-Budget.pdf
4
A. Definitions
Faculty Early Retirement Program (FERP): This program, which is part of the collective
bargaining agreement, allows eligible tenured faculty to retire and begin receiving
a pension while continuing to work for the CSU on a half-time basis. It is available
to tenured faculty, librarians and counselors.
Lecturer: Faculty employees hired on a temporary basis.
Probationary Faculty: Faculty hired into a tenure-track position who have not yet
received tenure.
Student-Faculty Ratio (SFR): SFR is calculated by dividing the systemwide full-time
equivalent students (FTES) by the systemwide full-time equivalent faculty (FTEF).
Because faculty have duties other than teaching, the calculated SFR is lower than
the average class size.
Tenured Faculty: Faculty who have received tenure in the CSU.
Tenure-track Faculty: Probationary and tenured faculty.
Tenure Density: “Tenure density” was calculated as tenure-track faculty (FTEF) divided
by total instructional FTEF (tenure-track plus lecturer FTEF). The data source for
this report was an annual compendium “snapshot” file extracted from the payroll information
system as of October 31 each year.
B. Role of Probationary and Tenured Faculty
Advancement of learning and development of new knowledge are critical contributions
of higher education. Well-educated students and alumni promote the public good and
contribute to local, regional and statewide economies. Tenure-track faculty, therefore,
are expected to engage in three complementary professional activities throughout their
careers:
(1) teaching to advance student learning;
(2) research, scholarly and creative activities to (i) engage students in research
to enhance their learning, and (ii) to further the development of peer and disciplinary
knowledge;
(3) service/professional activities to support the advancement of both the proximal
and distal learning community.
Teaching. The role of faculty in delivering instruction to students in classrooms,
laboratories, and/or studios is well recognized. However, a substantial amount of
leadership in curricular innovation and maintenance is provided almost exclusively
by probationary and tenured faculty due to their disciplinary expertise. For example,
tenure-track faculty are instrumental in such endeavors as developing new courses
and degree programs, assessing student learning outcomes in existing degree programs,
and mentoring students completing independent research and/or advanced degrees (with
undergraduate research, master’s thesis projects and doctoral dissertations). Further,
tenure-track faculty have redesigned courses to include high-impact practices and
have implemented innovative technologies to support student success and CSU progress-to-degree
efforts. The responsibility of assessment and continuous improvement of teaching courses
generally falls on tenure-track faculty. Tenure-track faculty provide advisement to
students, particularly in their students’ disciplinary studies, career options and
the graduate study preparation/application/selection process.
Research, Scholarly, and Creative Activities (RSCA). Tenure-track faculty create,
integrate, and/or disseminate knowledge in the disciplines and advance the learning
of their peers. Faculty RSCA are often
5
integrated into their teaching activities, often involve mentoring students in their
labs and studios, and may attract external grant support from industry, foundations
and government. Through their professional presentations, publications, art performances
and/or exhibitions, faculty also enhance the visibility and reputation of the CSU.
In service to the creation, integration and/or dissemination of new knowledge, tenure-track
faculty engage in activities such as serving as peer reviewers of manuscripts submitted
for publication in disciplinary journals, serving on editorial boards or as the editor
of disciplinary journals and serving in grant-review processes. Such activities, in
addition to contributing to the scientific and scholarly enterprise and to the prestige
of the CSU, maintain the faculty members’ currency in the field, contribute to student
success and contribute to CSU curricular innovation.
Service/Professional Activities. Tenure-track faculty contribute to shared governance
by participating in activities such as serving on departmental, campus-wide and systemwide
committees and task forces. Faculty may also engage in community, industry and/or
professional organizations and boards. These activities are often associated with
the faculty member’s disciplinary expertise and involve students. Often these activities
result in publications, presentations or other tangible outcomes that enhance the
reputation of the university. As noted by the ASCSU, “tenure-track faculty have played
critical roles in recent curricular redesign initiatives to reduce time to degree,
develop transfer pathways and improve textbook affordability” (AS-3240-15/FGA). Due
to their disciplinary expertise, tenured faculty have primary responsibility for two
vital campus service functions: (1) as peer reviewers in the retention, tenure, and
promotion processes as well as in periodic evaluations of faculty; and (2) as participants
on faculty search committees.
C. Role of Lecturers
The lecturers among the CSU faculty serve a variety of essential functions in the
university and their number has increased steadily. Lecturer faculty are typically
contracted to provide direct instruction and associated office hours. Their responsibilities,
unless specified by contract, do not include the additional responsibilities of supporting
curricular maintenance and innovation, engaging in scholarship and providing service
to the institution, the community, the CSU system or the discipline. However, some
lecturers have assigned responsibilities in these areas, based on their own expertise
and program needs.
Many lecturers, both part-time and full-time, have terminal degrees from the same
universities as tenure track faculty in their departments. Many also teach upper-division
and graduate classes; some are directors of graduate or undergraduate programs; and
many engage in the advising of students.
The increase in lecturers has come as the percentage of tenure track positions has
declined. It should be noted that some lecturer faculty go above and beyond their
contractual obligations, regardless of whether this is supported or not by their assignment.
The task force does not believe this is a fair or sustainable model, but does acknowledge
it. Additionally, some campuses have formalized roles for lecturers in shared governance.
II. Data
The task force reviewed and discussed information on the composition and demographics
of CSU faculty over time. The initial review included historical data going back to
1990, data on the role of enrollment in tenure density, and recent trends in tenure
density (Tables 1 and 2). In addition, the group reviewed data on the diversity of
tenured and probationary faculty. Finally, the task force discussed potential costs
associated with increasing tenure density.10
10 The Tenure Density Task Force recognizes that there are a variety of ways to calculate
tenure density. At the broadest level there is the difference between the density
calculated using headcount versus full-time equivalent faculty (FTEF). Data on both
are included in the attachments and both show declining tenure density, for the
6
purpose of this report we are using FTEF. More refined calculations of tenure density
could include accounting for graduate teaching and assigned time. A still more nuanced
look might calculate internal assigned time (chairs) differently than externally funded
assigned time (grant funded). Although all of these have merit, we are ultimately
constrained by the data available at the system level that will allow for consistent
measurement across time and 23 campuses. It is the view of the task force that while
each of these methods highlight different aspects of the problem, the trend lines
resulting from each approach reflect declining tenure density over time.
0
10
20
30
40
50
60
70
80
90
1990
1991
1992
1993
1994
1995
1996
1997
1998
1999
2000
2001
2002
2003
2004
2005
2006
2007
2008
2009
2010
2011
2012
2013
2014
2015
2016
CSU Tenure Density, 1990 - 2016
I. Background
The CSU strategic plan, Access to Excellence, issued in 2008, recognized the importance
of faculty as a “strategic asset” to the university. At the same time, the report
acknowledged that the “pattern across American higher education and within the CSU
in the last decade has been to shift reliance for instruction onto non-tenure-track
faculty.”3 These trends in tenure density have attracted attention from the ASCSU,
and we include here a list of related ASCSU resolutions and reports since 2000. The
statewide academic senate has consistently drawn attention to the importance of the
recruitment, hiring and retention of faculty (Attachment 2).
The role of tenure track faculty in student success has received national scholarly
attention as well. Jaeger and Eagan found that a higher proportion of contingent faculty
has a negative impact on student persistence.4 In a study using Higher Education Research
Institute (HERI) data gathered from a wide range of institutions, Umbach found “that
all faculty members’ commitment to teaching, regardless of appointment type, drops
as the proportion of part-time faculty increases.”5 A broad range of factors such
as financial aid status and preparation levels can influence graduation rates. In
their study Ehrenberg and Zhang indicated that “our estimates suggest that other factors
held constant, increases in either the percentage of faculty that are part-time or
the percentage of full-time faculty that are not on tenure tracks, each is associated
with a reduction in graduation rates.”6 Based on the above research findings, the
task force suggests that improved tenure density will have a positive impact on teaching,
persistence and graduation.
In 2001 the California Legislature passed ACR 73, calling for a plan to increase tenure
density to 75 percent.7 ACR 73 was a non-binding resolution, but in response the CSU,
the ASCSU, and the California Faculty Association (CFA) in July of 2002, issued A
Plan to Increase the Percentage of Tenured and Tenure-Track Faculty in the California
State University.8 In fall 2002 the CSU Board of Trustees’ budget included a request
for $35.6 million to begin incremental implementation of that plan in the 2003-04
academic year. The request was not funded, and the same request of $35.6 million was
included in the 2004-05 trustees’ budget request. The amount requested increased over
the years, and in 2009-10 the request was $42 million. In the seven years that the
request was included in the trustees’ budget, it was never funded. After seven unsuccessful
requests, funding was no longer included in CSU Trustees’ budget request beginning
with the 2010-11 budget cycle.9
Although the resulting plan was never fully realized, the 2002 report highlights the
importance of a strong foundation of tenured and tenure-track faculty to the success
of the institution. Recognition of the need for tenured faculty in the CSU has once
again become evident in the legislative arena. AB 1464, introduced on February 17,
2017, by Assembly Member Shirley Weber, called on the CSU to increase the percentage
of tenured and tenure-track faculty and to improve faculty diversity, but the bill
was not enacted.
II. Data
A. Historical Data
In these first two tables, graphs show the decline in tenure density in the CSU over
the period from 1990 to 2016.
Table 1
Source: CSU System Human Resources
0
10
20
30
40
50
60
70
80
90
1990-1994
1995-1999
2000-2004
2005-2009
2010-2014
Current 2016
CSU Tenure Density, 1990-2016
B. Faculty and SFR
The decline in the percent (and number) of faculty on the tenure-track may be assumed
to have had an impact of the experience of students. Student-faculty ratio has edged
up only slightly in the last 10 years from 21.0:1 to 22.1:1 (Table 3), and has trended
downward since 2012. However, over the same period, the ratio of students to tenure-track
faculty has gone from 34.1:1 in 2007 to 39.4:1 ten years later. This means that students
are having less access to and interaction with long-term tenured faculty, who are
responsible for the curriculum and programs enrolling students.
Table 3: Student Faculty Ratio
Fall Term
Full–Time Equivalents(FTE) Ratios
Students Lecturers Tenure–Track All Faculty (Lect + TT) Student to Ten–Track Faculty
Student to All Faculty Tenure Density (TT/All Fac)
2007 356,547.3 6,513.3 10,459.9 16,973.2 34.1 21.0 61.6%
2008 362,086.2 6,305.5 10,497.7 16,803.2 34.5 21.5 62.5%
2009 357,601.4 5,286.0 10,425.5 15,711.5 34.3 22.8 66.4%
2010 343,319.4 5,376.1 9,874.3 15,250.4 34.8 22.5 64.7%
2011 361,675.9 5,957.1 9,813.0 15,770.1 36.9 22.9 62.2%
2012 369,163.7 6,227.0 9,702.7 15,929.7 38.0 23.2 60.9%
2013 379,387.1 6,821.7 9,669.0 16,490.7 39.2 23.0 58.6%
2014 391,531.8 7,459.4 9,796.9 17,256.3 40.0 22.7 56.8%
2015 404,746.3 7,909.9 10,042.9 17,952.8 40.3 22.5 55.9%
2016 409,382.1 8,156.6 10,394.3 18,550.9 39.4 22.1 56.0%
Source: CSU System Human Resources
C. Faculty Headcount and Tenure Density
As a starting point for discussion, Academic Human Resources, Office of the Chancellor
provided tracking data showing headcounts and full-time equivalent faculty (FTEF)
over nine years (from fall 2008 to fall 2016). For this report, tenure-track faculty
were defined as tenured and probationary instructional faculty, and lecturers were
defined as instructional faculty in temporary positions. Department chairs are included.
Participants in the FERP program were included as tenured faculty at their appointment
time-base in the fall term for a given year. The report did not include librarians,
counselor faculty unit employees, or coaching faculty unit employees.
Full-time equivalent faculty (FTEF) were derived by summing the appointment time bases.
For example, three faculty with individual time bases of 1.0, 0.5, and 0.5 would generate
2.0 FTEF.
There is considerable variation in tenure density among the 23 universities in the
CSU (Attachment 3). For example, tenure density on each campus ranged from 39.8% to
65.3% in 2016. The declining trend in tenure density is depicted in Table 1 titled
“CSU Tenure Density, 1990-2016.” The years included show the impact of the recession
as well as a period of recovery and growth. For example, in the last decade the high
point for tenure density was fall 2009, but the increase from 62 percent to 66 percent
in a single year (fall 2008 to fall 2009) was driven by a loss of over 1,000 FTEF
in lecturers. This was in turn driven by reductions in class offerings during the
budget crisis. From fall 2009 to fall 2010, tenure-track FTEF fell by 500, driven
by a spike in retirements and the lowest number of new faculty hires since the CSU
began tracking that information. Since 2013, tenure-track headcounts and FTEF have
increased every year, but tenure density continued to decline until the fall 2016;
it averaged 56 percent in the CSU.
D. Faculty Age and Separations
Several additional reports were provided and discussed to examine potential changes
in the tenured faculty workforce. These included a report on faculty age distribution
(Attachment 4) and a report on faculty separations (Attachment 5), which details the
number of retirees participating in the Faculty Early Retirement Program (FERP).
Longitudinal data on age distribution, going back to 1988, show that the average age
of full-time faculty age has hovered between 50 and 51 since at least the mid-1990s.
Although the average age has been trending downward for the last few years, almost
23 percent of full-time faculty in fall 2016 were age 60 or older. Thus, nearly one-quarter
of the faculty are at or very near retirement age.
As shown in Attachment 5, longitudinal data on employment separations show fluctuation
over time, often driven by external factors. Over the past two decades, two out of
three tenure-track faculty separations were due to retirements. Budget downturns,
collective bargaining agreements and prior “Golden Handshake” programs, for example,
may be associated with decreases or spikes in retirements. The number of “other separations”
tends to increase during periods when large numbers of probationary faculty have been
hired; probationary faculty are more likely to resign than those with tenure. In 2015-16,
tenure-track faculty separations were approximately evenly due to retirements and
“other.” It is important to note that over the last twenty years an average of 600
faculty have retired or resigned annually. Thus a substantial number of faculty must
be replaced each year due to ongoing attrition.
The task force discussed an additional relevant data source, the annual CSU Faculty
Recruitment and Retention Survey. The most recent report can be found at http://www.calstate.edu/hr/faculty-resources/research-analysis/faculty-recruitment-reports.shtml. The survey collects information on numbers of searches initiated and completed,
numbers of applicants by discipline, salary trends, new hire demographics, support
packages provided to new hires and other information. A separate component of the
survey collects information on tenure denials, non-retention decisions, resignations,
and the reasons given for those resignations. After several years of very low rates
of hiring, the campuses have greatly increased the number of recruitments, resulting
in more than 2,400 new tenure-track hires over the past three years.
Faculty Diversity
Increasing tenure density could provide the opportunity to expand faculty diversity,
which, along with increasing tenure density was also a goal of the Access to Excellence
strategic plan. Recently, the CSU Task Force Report on the Advancement of Ethnic Studies
(2016) drew on existing research to emphasize the importance of diversity in the classroom.
The study stated: “There has been a growing base of evidence demonstrating the value
of exposure to demographic and cultural diversity in the classroom on intellectual
achievement and ability to interact positively in a multiethnic world.”
Faculty diversity provides students with varying intellectual perspectives, approaches
to teaching and world views that may differ from their own, or may reflect what is
often underrepresented in academia. Diversifying the tenured and tenure-track faculty
in the CSU can provide traditionally underrepresented students and first-generation
students influential role models that haven proven to be critical to student success.
The following two tables provide data on the diversity of tenure-track faculty on
the CSU. Table 5 shows the number of full-time tenured and probationary faculty, by
race and ethnicity in fall 2016.
The percentage of faculty who are ethnically diverse or female is greatest among the
most recently hired faculty at the assistant professor rank. Thus, assuming that these
newly-recruited faculty are retained, we can expect that the tenured faculty will
be increasingly diverse over time.
Table 4: Race, Ethnicity and Gender of CSU Faculty in Fall 2016, by Rank
Professor Associate Professor Assistant Professor
Race/Ethnicity Female Male Female Male Female Male
American Indian 13 20 6 6 13 11
Asian 326 524 270 246 342 265
African American 73 86 55 59 76 50
Hispanic 203 267 100 118 164 123
Native Hawaiian/Pacific Islander 1 6 0 1 2 2
Two or more races 15 21 5 6 18 17
White 1,410 2,084 715 713 821 750
Unknown 47 103 59 71 139 125
Source: Fall 2016 “snapshot” file from the Campus Information Retrieval System (CIRS),
derived from CSU payroll data.
Table 5: Detailed Race and Ethnicity of New Tenure-track Hires, 2009/10 through 2016/17
| Year | Amer. Indian/Alaska Native | Asian | African American | Hispanic | Native Amer./Pacific Islander | White | Two or More Races | Other/Unknown | Total |
|---|---|---|---|---|---|---|---|---|---|
| 2016 | 8 (0.9%) | 184 (21.5%) | 56 (6.6%) | 91 (10.7%) | 7 (0.8%) | 422 (49.4%) | 13 (1.5%) | 73 (8.5%) | 854 |
| 2015 | 6 (0.7%) | 174 (20.5%) | 36 (4.2%) | 94 (11.1%) | 1 (0.1%) | 478 (56.3%) | 16 (1.9%) | 44 (5.2%) | 849 |
| 2014 | 9 (1.2%) | 137 (18.5%) | 34 (4.6%) | 63 (8.5%) | 3 (0.4%) | 419 (56.5%) | 11 (1.5%) | 66 (8.9%) | 742 |
| 2013 | 6 (1.3%) | 104 (22.1%) | 23 (4.9%) | 40 (8.5%) | 0 | 272 (57.9%) | 9 (1.9%) | 16 (3.4%) | 470 |
| 2012 | 5 (1.3%) | 72 (18.8%) | 15 (3.9%) | 26 (6.8%) | 1 (0.3%) | 234 (61.3%) | 3 (0.8%) | 26 (6.8%) | 382 |
| 2011 | 6 (1.3%) | 96 (21.2%) | 17 (3.8%) | 44 (9.7%) | 3 (0.7%) | 248 (54.7%) | 12 (2.6%) | 27 (6%) | 453 |
| 2010 | 3 (2.8%) | 23 (21.3%) | 6 (5.6%) | 7 (6.5%) | 0 | 54 (50%) | 0 | 15 (13.9%) | 108 |
| 2009 | 2 (0.6%) | 86 (24.0%) | 12 (3.4%) | 32 (8.9%) | 0 | 191 (53.2%) | 4 (1.1%) | 32 (8.9%) | 359 |
| Total | 45 (1.1%) | 876 (20.8%) | 199 (4.7%) | 397 (9.4%) | 15 (0.4%) | 2,318 (55.0%) | 68 (1.6%) | 299 (7.1%) | 4,217 (100%) |
Source: Annual CSU Faculty Recruitment and Retention Survey.
E. Finance
The experience surrounding ACR 73 highlights the importance funding plays in the improvement of tenure density. As noted earlier, in response to an Assembly resolution, faculty and administration worked together in 2002 to develop a plan that would increase tenure density to 75 percent. Over the next seven years the report’s recommendations were never funded, and tenure density has declined in the years since its release. A clear understanding of the cost implications is critical to long-term improvement in tenure density.
1. Budget Process Impact on Tenure Density
When looking at campus hiring practices, it is useful to focus on the CSU budget cycle. Although campus budgets are based on anticipated revenue for the following fiscal year, the reality of the state budget process is that there are routine adjustments made to the CSU state support budget in the final Budget Act, resulting in changes to the CSU state appropriation and/or budget priorities very late in the funding cycle. When this cycle results in reductions to CSU appropriations, such as happened during the last recession, the only practical way that campuses can effectively reduce their academic affairs operating costs for the new fiscal year is by not renewing temporary faculty appointments. This simple fiscal reality explains why 2009 was a high point for tenure density. A brief analysis of the data for that year shows that tenure-track numbers remained essentially the same as the prior year, while a significant increase in tenure density resulted from over 2,100 fewer lecturers being appointed in 2009 (1,035 FTE). In this case, campuses had to align academic affairs budgets with substantially reduced operational revenues. The obverse situation occurs when the CSU receives a last-minute augmentation in its state appropriation in the budget process. This creates a similar dilemma for campus budget planners, who in that case would have additional funds available for the following academic year, but do not have the time to complete the tenure-track hiring process. By the end of the fiscal year, the campus will have completed its tenure-track hiring for the following academic year, with no time or ability to add additional tenure-line hires. Therefore, the only practical way to convert additional budget dollars into additional course sections for the fall semester/quarter is to add more temporary faculty. If the additional monies are “one-time” augmentations to the CSU budget, this is effectively the only practical way to spend such non-reoccurring revenues.
Even when the CSU receives an augmentation to its base budget, there are still several very practical problems in immediately converting those additional resources into tenure-track hires. For example, campuses are currently operating close to capacity in relation to the number of tenure-track searches that can be conducted each year. The net result of all this sustained effort is that the average number of new tenure-track hires barely offsets the number of tenured faculty who leave the system in any given year. In addition, tenure-track searches take time and add one-time costs to the department. Each tenure-line hire cost is substantially greater than adding an additional FTEF lecturer. This is true for at least three reasons: (1) Lecturers are available in pre-determined part-time lecturer pools, from which a department chair can readily hire instructors. This is a stop gap in meeting the needs of additional last-minute student demand for classes; (2) One FTEF lecturer teaches five 3-unit course sections, as opposed to three 3-unit sections for a tenure-track hire (hence, more classroom instruction for the same FTEF); and (3) Lecturers tend to teach higher-enrollment service courses, including scaled online sections. This significantly higher SFR for classes taught by lecturers greatly increases the number of students that a major can accommodate. However, heavy reliance on lecturers likely does not provide the mentoring, counseling, engagement in high-impact practices and curriculum guidance tenure-track faculty offer. These functions, as opposed to simply teaching more students, can make a difference in increasing graduation rates.
When campuses are faced with meeting the legitimate needs and expectations of a growing student population in any given academic year, there is an almost inevitable move toward using temporary faculty to serve those students. This shift decreases tenure density. Given the way that final campus appropriations are indelibly linked to the state and CSU system budget process, it is unlikely that this dynamic will change unless the CSU moves toward a more stable, certain and perhaps multi-year approach to the budget and to our hiring practices. Instead of declining tenure track hires in favor of lecturer positions, perhaps approaches such as a three year cycle for tenure track hiring or the hiring of otherwise qualified lecturers into tenure track positions (but not replacing existing tenure track hires) would produce change. Absent some fundamental re-thinking as to how the state, the CSU and campuses manage and/or budget for additional tenure track faculty hiring, this trend toward reduced tenure density will likely continue.
2. Cost Analysis
Any cost analysis of increasing tenure density should start with the understanding that approximately 600 tenured and probationary faculty depart from the university each year (Attachment 5). This attrition is the result of multiple variables, including retirement, resignation and denial of tenure among other factors. Therefore, this section begins with an analysis of the funds needed to replace such separated faculty and then continues with the costs of improving tenure density, by one percent increments. Improving tenure density must be a function of the baseline or maintenance funding necessary to replace departing tenure and tenure-track faculty, plus additional funding needed to increase tenure density.
Replacement of tenure-track faculty
The following assumptions were used to estimate the impact of replacing 600 faculty
per year.
Cost of new tenure-track hire
• Average salary for new tenure-track faculty in fall 2015 was about $76,000.
• With benefits, $110,000 (44 percent cost for benefits) is the rough number for ongoing
costs of a new faculty line.
Savings from faculty being replaced
• Average salary (all tenure-track faculty) in fall 2016 was $92,000.
• With benefits, this is about $132,000 (44 percent cost for benefits). Assuming faculty
turnover results from retirements (largely full professors) and resignations or other
separations (largely more junior faculty), using the overall average salary and benefits
to estimate savings from annual separations makes sense.
Impact of replacing 600 faculty due to retirement or separation
• Compensation savings associated with replacing separating faculty with new hires
is about $22,000 per position.
• One-time costs per recruitment estimated as $15,000.
• One-time start-up costs including allocations for supplies, equipment, travel, etc.,
new faculty assigned time, and moving expenses estimated as $50,000 (Based on data
from the Faculty Recruitment and Retention Survey).
Assuming a need to replace 600 tenure-track faculty with 600 tenure-track faculty
annually, we would see a compensation savings of $13.2 million offset by $39 million
in one-time costs, or a net deficit of $25.8 million.11
Assumptions of an incremental cost approach to changing tenure density:
The following starting numbers were used to estimate the additional financial impact
of improving tenure density. All costs would be in addition to costs associated with
replacing approximately 600 faculty per year.
• Tenure density of 55.5 percent
• 18,551 current Full Time Equivalent Faculty (FTEF)
• 10,293 current tenure-track FTEF
• 8,258 current lecturer FTEF
Calculation of costs associated with an incremental approach to changing tenure density
(one percent):
In order to create a cost model, for the purpose of this report, we have limited calculations
to an incremental cost model without other mitigating constraints. To determine what
we must replace each year, plus what it would take to add each additional one percent
to tenure density, while keeping the number of lecturers constant. This is consistent
with a prudent growth model.12
• Cost of replacing the 600 tenure-track faculty due to retirement and separation
is assumed to be $25.8 million per the above calculation.
• Additional number of hires to increase tenure density by one percent given the current
55.5 percent tenure density (based on 10,293 tenure-track FTEF and 18,551 total FTEF),
would necessitate 425 new tenure-track hires (i.e. a new total of 10,718 tenure-track
FTEF with a new total of 18,976 FTEF = 56.5 percent).
• The cost of hiring these 425 tenure-track hires would be $47 million ($110k*425),
per year plus $27 million in one-time costs ($65k*425).
• Therefore, to increase tenure density by one percent, the CSU would need to hire
1,025 tenure-track faculty (600 to replace attrition and 425 to increase tenure density
by one percent). The cost of this goal would be $72.8 million per year ($25.8 million
to replace faculty attrition and $47 million in new hire salaries) plus $27 million
in one-time costs (each year), or a total of $99.8 million per year.
• Each additional one percent increase would involve a similar incremental cost.
• Costs would be mitigated slightly if the lecturer population declined over time.
However, the extent to which total FTEF grows will depend on actual enrollment growth
over time.
• These costs do not consider infrastructure needed to support additional tenure-track
faculty, such as office and laboratory space. Many campuses are currently at capacity
in these areas, and new investment would be needed to accommodate significant numbers
of additional faculty.
This analysis suggests that in order to increase tenure density by one percent per
year, an additional $100 million in permanent funding would be needed in the first
year, with an ongoing increase in permanent funding each year thereafter—beginning
at $47 million and increasing over time as compensation costs increase, until the
system reaches a desired proportion of tenured faculty. The number of additional faculty
needed to increase tenure density by one percent would also increase as total faculty
FTEF, further affecting the cost. Adding these additional faculty would increase instructional
capacity by approximately 2,550 class sections per year and would support the Graduation
Initiative 2025. Even with this one percent increase per year, it must be noted that
critical core needs would remain: additional staff to support the Graduation Initiative
2025; increased enrollment; compensation increases for all faculty and staff; retirement
costs, including retiree medical; health care costs; deferred maintenance; and capital
investment for classrooms, labs, and offices.
III. Principles to Guide Tenure Density Improvement Plans
These principles are intended to guide campus and system consideration of tenure density.
They recognize the role of faculty, the importance of planning, the value of considering
campus specific conditions and the need to be informed by data. They also include
the importance of innovation in approaching this issue.
• Planning and implementation are expected to be carried out with faculty consultation.
• Decisions should be informed by available data, be consistent with the university
mission, and support students, faculty and all university employees.
• Diversity should be considered when campuses develop their plans.
• Campus plans should examine ways to maximize resources in innovative ways.
• Campus plans should include a lower-limit scenario, within a cost-neutral environment
that makes progress towards the goal of increasing tenure density to better serve
students.
• Campus plans should include aspirational goals, aligned with projected student growth
estimates.
• Campus plans should consider specific needs and the particular contributions of
faculty in tenure-track positions and in lecturer positions toward satisfying those
needs.
• Campus plans should consider accreditation requirements.
IV. Best Practices
In response to Chancellor White’s request that the task force suggest “best practices,” the task force has assembled the following list. This includes best practices for (a) determining the appropriate size and tenure-track ratio of the faculty through planning, and evaluating progress; (b) carrying out effective recruiting; (c) increasing the diversity of the faculty; (d) retaining faculty once they are hired. These practices also affirm the critical importance of diversity in hiring and retention.
A. Planning and Evaluating Progress
• Identify the number of the faculty at the department, school or college and campus
level needed to provide student access to courses and facilitate student success in
undergraduate and graduate programs.
• Departments may consider the number of general education and lower-division general
education and service courses offered as a part of developing their plan.
• Create a multi-year faculty hiring plan that (1) addresses the principles above;
(2) provides the faculty in roles needed for university, faculty, and student success;
(3) fits within existing resource allocations; and (4) is sustainable over time.
• Consider, when developing hiring plans, the impact of anticipated retirements.
• Determine infrastructure needs, such as offices, labs, instructional and academic
technology needs.
• Establish a process for monitoring and reporting systems and campus metrics on an
annual basis.
B. Recruiting and Hiring
• Identify resources available for all types of faculty hires, including resources
to support start-up costs.
• Include personal and proactive outreach in faculty recruitments that go beyond passive
advertising. Effective strategies include hiring qualified lecturer faculty as tenure-track
faculty as appropriate, taking advantage of disciplinary connections, making direct
calls and emails to colleagues at other institutions and to potential candidates and
taking advantage of the Chancellor’s Doctoral Incentive Program Directory of Recipients.
• Align campus priorities and values with the hiring process to attract candidates
who are a good fit for the system and with campus mission and values.
• When a recruitment produces multiple well-qualified candidates and need can be demonstrated,
have policies and practices in place to allow multiple hires from a single recruitment.
C. Diversifying
• Carry out faculty searches and appointments within campus policies that ensure equity,
produce broad, diverse candidate pools, and that include training to ensure effective
recruitments and eliminate unconscious bias.
• Include trained diversity advocates or equal employment opportunity designees on
search committees to provide oversight and guidance on ways to expand pools and identify
problematic practices during the recruitment.
D. Retaining
• Ensure that faculty compensation and benefits encourage retention, provide start-up
and facilities, and make faculty members aware of employment benefits and institutional
support, including support for work-life balance and sufficient support to faculty
success in achieving tenure and promotion (including engaging in research and scholarship).
• Align campus priorities with resources in ways that allow faculty to be productive
and focus on their core responsibilities, serving campus needs strategically.
• Develop programs that respond to factors that negatively affect faculty retention;
ensure timely orientations, appropriate mentoring and ongoing support during the probationary
period.
V. Recommendations
A. System
• Establish a standard definition for tenure-density and disseminate definition to
campuses.
• Develop a new metric for the number of students (FTES) to tenure-track faculty (FTEF)
ratio, to better gauge the capacity of campuses with regard to tenure-track faculty.
• Establish a process for reporting systemwide and campus metrics, including tenure
density and student-to-tenure-track faculty ratio (SFR, FTEF, and FTES).
• Collect and disseminate campus and system data on an annual basis.
• Lobby the legislature and governor, in collaboration with CFA, ASCSU, faculty, and
students, for more state funding to meet tenure-track faculty needs to better serve
CSU students.
•
B. Campuses
• Develop a campus-specific tenure density plan (that should include targets) based
on the needs and resources of the campus.
• Ensure that, at the campus level, when a tenure-track faculty member leaves the
university, he or she is replaced with another tenure-track faculty member (although
depending on academic program needs, not necessarily in the same discipline or specialty).
• Recruit, hire, and retain a diverse and qualified group of tenure-track faculty
each year that exceeds the number of tenure-track faculty leaving the campus.
• Consider qualified lecturer faculty for tenure-track faculty positions, as appropriate.
• Monitor and report to all relevant parties annually the progress on meeting the
goals.
Attachment 1
Attachment 2 ASCSU Resolutions Relating to Hiring of Tenure-Track Faculty Since 2000
(Does not include annual resolutions on CSU budget priorities)
AS-3240-15/FGA (Rev)
Approved Unanimously
January 2016
Request for Joint Task Force to Develop an Action Plan for Increasing Tenure/Tenure-Track
Density in the CSU (pdf)
AS-3207-15/FA (Rev)
Approved Without Dissent
May 2015
The Call for a Plan to Increase Tenure Density in the California State University
(pdf)
AS-3178-14/EX
Approved Unanimously
May 2014
Request for Annual Progress Reports on Access to Excellence Strategic Plan Through
2018 (pdf)
AS-3142-13/FA
Approved
September 2013
Addressing the Urgent Need for New Tenure Line Faculty in the California State University
(CSU) (pdf)
AS-3067-12/FA (Rev)
Approved Unanimously
May 2012
"CSU Faculty Profile: Proportion of Tenure-Track/Tenured Faculty and Demographic Trends,
2001-2009" Report On Commitment 2 of the CSU Access to Excellence Strategic Plan (Attachment
1), (Attachment 2 ) 4.0MG, (pdf) 4.2 MB
AS-3054-12/FGA/FA (Rev)
Approved Unanimously
March 2012
Implementation of Access to Excellence CSU Strategic Plan Commitment 2: Plan for Faculty
Turnover and Invest in Faculty Excellence (Attachment), (pdf)
AS-2991-10/FA (Rev)
Approved
January 2011
Investing in Faculty Resources to Ensure Quality Education in the California State
University (.pdf)
AS-2873-08/FA (Rev)
Approved Unanimously
January 2009
Collecting Survey Data Concerning Voluntary Faculty Separations and Declined Offers
of Employment from the CSU (Attachment 1) (Attachment 2) (.pdf)
AS-2772-06/FGA/FA
Approved Unanimously
November 2006
Advocating for Additional Funding for CSU Budget Challenges and Unmet Needs (.pdf)
AS-2771-06/AA/FGA
Approved Unanimously
November 2006
Fulfilling the Principles of Cornerstones in the New Strategic Plan (.pdf)
AS-2723-05/FA
Approved Unanimously
January 2006
Providing Newly Recruited Faculty with Necessary Support (.pdf)
AS-2702-05/FA/FGA
Approved Unanimously
May 2005
Faculty Compensation and the Crisis in Recruiting and Retaining Faculty of High Quality
(Attachment) (.pdf)
AS-2624-03/FA
Approved
September 2003
Tenure-Track Hiring in the Context of Reduced Budgets (.pdf)
AS-2608-03/FA
Approved)
May 2003
The Report of the Faculty Flow Committee
(.pdf)
AS-2547-01/EX
Approved Unanimously
September 2001
The California State University at the Beginning of the 21st Century: Meeting the
Needs of the People of California (.pdf) (Attachment, .pdf, 685KB)
AS-2497-00/FA
Approved
May 2000
Faculty Recruitment and Retention (.pdf)
Attachment 3
Campus Tenure Status Fall Instructional Faculty Headcount
| Campus | Tenure Status | Fall Instructional Faculty Headcount | |||||||||
|---|---|---|---|---|---|---|---|---|---|---|---|
| 2007 | 2008 | 2009 | 2010 | 2011 | 2012 | 2013 | 2014 | 2015 | 2016 | ||
| Bakersfield | Tenure-track | 221 | 208 | 203 | 185 | 182 | 186 | 186 | 186 | 191 | 207 |
| Lecturers | 196 | 198 | 163 | 171 | 189 | 184 | 202 | 228 | 256 | 306 | |
| Total | 417 | 406 | 366 | 356 | 371 | 370 | 388 | 414 | 447 | 513 | |
| Channel Islands | Tenure-track | 77 | 84 | 82 | 80 | 81 | 86 | 95 | 107 | 115 | 127 |
| Lecturers | 193 | 194 | 182 | 179 | 189 | 228 | 253 | 268 | 266 | 294 | |
| Total | 270 | 278 | 264 | 259 | 270 | 314 | 348 | 375 | 381 | 421 | |
| Chico | Tenure-track | 520 | 523 | 504 | 480 | 466 | 452 | 441 | 442 | 458 | 474 |
| Lecturers | 486 | 445 | 384 | 378 | 408 | 413 | 467 | 511 | 510 | 506 | |
| Total | 1,006 | 968 | 888 | 858 | 874 | 865 | 908 | 953 | 968 | 980 | |
| Dominguez Hills | Tenure-track | 275 | 266 | 257 | 241 | 224 | 210 | 213 | 222 | 238 | 245 |
| Lecturers | 428 | 431 | 355 | 370 | 462 | 478 | 513 | 547 | 594 | 599 | |
| Total | 703 | 697 | 612 | 611 | 686 | 688 | 726 | 769 | 832 | 844 | |
| East Bay | Tenure-track | 346 | 359 | 355 | 320 | 308 | 303 | 311 | 320 | 327 | 345 |
| Lecturers | 431 | 452 | 370 | 300 | 362 | 396 | 440 | 460 | 506 | 502 | |
| Total | 777 | 811 | 725 | 620 | 670 | 699 | 751 | 780 | 833 | 847 | |
| Fresno | Tenure-track | 566 | 578 | 571 | 553 | 533 | 519 | 534 | 544 | 540 | 572 |
| Lecturers | 727 | 712 | 565 | 577 | 551 | 669 | 739 | 764 | 796 | 830 | |
| Total | 1,293 | 1,290 | 1,136 | 1,130 | 1,084 | 1,188 | 1,273 | 1,308 | 1,336 | 1,402 | |
| Fullerton | Tenure-track | 724 | 725 | 741 | 726 | 733 | 745 | 751 | 767 | 799 | 826 |
| Lecturers | 1,253 | 1,098 | 856 | 945 | 1,097 | 1,163 | 1,173 | 1,274 | 1,250 | 1,255 | |
| Total | 1,977 | 1,823 | 1,597 | 1,671 | 1,830 | 1,908 | 1,924 | 2,041 | 2,049 | 2,081 | |
| Humboldt | Tenure-track | 272 | 263 | 253 | 233 | 230 | 227 | 231 | 219 | 226 | 240 |
| Lecturers | 230 | 238 | 236 | 253 | 271 | 302 | 288 | 306 | 324 | 318 | |
| Total | 502 | 501 | 489 | 486 | 501 | 529 | 519 | 525 | 550 | 558 | |
| Long Beach | Tenure-track | 853 | 845 | 849 | 816 | 796 | 785 | 777 | 795 | 789 | 818 |
| Lecturers | 1,209 | 1,279 | 1,055 | 994 | 1,122 | 1,042 | 1,119 | 1,241 | 1,332 | 1,356 | |
| Total | 2,062 | 2,124 | 1,904 | 1,810 | 1,918 | 1,827 | 1,896 | 2,036 | 2,121 | 2,174 | |
| Los Angeles | Tenure-track | 531 | 529 | 552 | 533 | 526 | 516 | 508 | 510 | 518 | 529 |
| Lecturers | 687 | 659 | 478 | 488 | 573 | 576 | 618 | 776 | 915 | 1,054 | |
| Total | 1,218 | 1,188 | 1,030 | 1,021 | 1,099 | 1,092 | 1,126 | 1,286 | 1,433 | 1,583 | |
| Maritime | Tenure-track | 41 | 40 | 44 | 47 | 43 | 45 | 50 | 52 | 51 | 52 |
| Lecturers | 34 | 34 | 34 | 32 | 31 | 27 | 37 | 37 | 36 | 38 | |
| Total | 75 | 74 | 78 | 79 | 74 | 72 | 87 | 89 | 87 | 90 | |
| Monterey Bay | Tenure-track | 104 | 108 | 112 | 114 | 120 | 119 | 116 | 118 | 150 | 154 |
| Lecturers | 185 | 170 | 151 | 190 | 194 | 246 | 256 | 312 | 302 | 312 | |
| Total | 289 | 278 | 263 | 304 | 314 | 365 | 372 | 430 | 452 | 466 | |
| Northridge | Tenure-track | 754 | 763 | 737 | 703 | 765 | 794 | 790 | 787 | 830 | 813 |
| Lecturers | 1,064 | 1,076 | 1,013 | 1,016 | 1,055 | 1,039 | 1,156 | 1,221 | 1,238 | 1,292 | |
| Total | 1,818 | 1,839 | 1,750 | 1,719 | 1,820 | 1,833 | 1,946 | 2,008 | 2,068 | 2,105 | |
| Pomona | Tenure-track | 577 | 548 | 537 | 493 | 490 | 510 | 498 | 520 | 525 | 553 |
| Lecturers | 595 | 472 | 472 | 458 | 529 | 548 | 560 | 630 | 700 | 670 | |
| Total | 1,172 | 1,020 | 1,009 | 951 | 1,019 | 1,058 | 1,058 | 1,150 | 1,225 | 1,223 | |
| Sacramento | Tenure-track | 744 | 736 | 734 | 680 | 650 | 620 | 610 | 633 | 628 | 640 |
| Lecturers | 798 | 722 | 661 | 513 | 642 | 656 | 753 | 835 | 880 | 980 | |
| Total | 1,542 | 1,458 | 1,395 | 1,193 | 1,292 | 1,276 | 1,363 | 1,468 | 1,508 | 1,620 | |
| San Bernardino | Tenure-track | 403 | 409 | 407 | 385 | 385 | 385 | 393 | 404 | 401 | 420 |
| Lecturers | 486 | 510 | 411 | 410 | 406 | 435 | 468 | 480 | 544 | 530 | |
| Total | 889 | 919 | 818 | 795 | 791 | 820 | 861 | 884 | 945 | 950 | |
| San Diego | Tenure-track | 832 | 818 | 801 | 761 | 769 | 732 | 716 | 715 | 719 | 735 |
| Lecturers | 972 | 938 | 718 | 709 | 690 | 660 | 775 | 876 | 913 | 925 | |
| Total | 1,804 | 1,756 | 1,519 | 1,470 | 1,459 | 1,392 | 1,491 | 1,591 | 1,632 | 1,660 | |
| San Francisco | Tenure-track | 802 | 817 | 804 | 760 | 744 | 730 | 743 | 736 | 733 | 759 |
| Lecturers | 871 | 767 | 572 | 715 | 763 | 884 | 884 | 863 | 885 | 918 | |
| Total | 1,673 | 1,584 | 1,376 | 1,475 | 1,507 | 1,614 | 1,627 | 1,599 | 1,618 | 1,677 | |
| San Jose | Tenure-track | 708 | 710 | 710 | 666 | 653 | 658 | 661 | 656 | 672 | 696 |
| Lecturers | 1,166 | 1,193 | 990 | 943 | 1,112 | 1,063 | 1,069 | 1,121 | 1,126 | 1,146 | |
| Total | 1,874 | 1,903 | 1,700 | 1,609 | 1,765 | 1,721 | 1,730 | 1,777 | 1,798 | 1,842 | |
| San Luis Obispo | Tenure-track | 665 | 690 | 686 | 651 | 644 | 643 | 634 | 647 | 664 | 680 |
| Lecturers | 448 | 425 | 377 | 388 | 418 | 403 | 464 | 510 | 544 | 581 | |
| Total | 1,113 | 1,115 | 1,063 | 1,039 | 1,062 | 1,046 | 1,098 | 1,157 | 1,208 | 1,261 | |
| San Marcos | Tenure-track | 220 | 224 | 219 | 216 | 237 | 234 | 233 | 244 | 255 | 264 |
| Lecturers | 298 | 259 | 290 | 293 | 332 | 344 | 381 | 414 | 462 | 483 | |
| Total | 518 | 483 | 509 | 509 | 569 | 578 | 614 | 658 | 717 | 747 | |
| Sonoma | Tenure-track | 267 | 266 | 270 | 253 | 252 | 241 | 228 | 225 | 234 | 238 |
| Lecturers | 291 | 301 | 231 | 266 | 235 | 261 | 281 | 312 | 311 | 337 | |
| Total | 558 | 567 | 501 | 519 | 487 | 502 | 509 | 537 | 545 | 575 | |
| Stanislaus | Tenure-track | 261 | 267 | 260 | 242 | 248 | 241 | 242 | 253 | 251 | 266 |
| Lecturers | 255 | 232 | 132 | 202 | 200 | 216 | 250 | 277 | 304 | 339 | |
| Total | 516 | 499 | 392 | 444 | 448 | 457 | 492 | 530 | 555 | 605 | |
| Systemwide | Tenure-track | 10,763 | 10,776 | 10,688 | 10,138 | 10,079 | 9,981 | 9,961 | 10,102 | 10,314 | 10,653 |
| Lecturers | 13,303 | 12,805 | 10,696 | 10,790 | 11,831 | 12,233 | 13,146 | 14,263 | 14,994 | 15,571 | |
| Total | 24,066 | 23,581 | 21,384 | 20,928 | 21,910 | 22,214 | 23,107 | 24,365 | 25,308 | 26,224 | |
Headcounts as of October 31 each year
Includes instructional faculty; excludes coaches, counselors, and librarians
Includes active faculty; excludes leave without pay
Tenure status based on class code
Source data: CIRS AN file
Academic Human Resources
CSU Office of the Chancellor, May 2017
Attachment 3 Campus Tenure Status Fall Instructional Faculty Full-Time Equivalents (FTE)
| Campus | Tenure Status | Fall Instructional Faculty Full-Time Equivalents (FTE) | |||||||||
|---|---|---|---|---|---|---|---|---|---|---|---|
| 2007 | 2008 | 2009 | 2010 | 2011 | 2012 | 2013 | 2014 | 2015 | 2016 | ||
| Bakersfield | Tenure-track | 219.5 | 202.3 | 197.4 | 181.8 | 177.6 | 180.7 | 179.9 | 181.0 | 185.9 | 200.7 |
| Lecturers | 122.0 | 118.9 | 98.3 | 102.5 | 109.8 | 115.5 | 127.5 | 142.1 | 158.2 | 161.7 | |
| Total | 341.5 | 321.2 | 295.7 | 284.3 | 287.4 | 296.2 | 307.4 | 323.1 | 344.1 | 362.4 | |
| Tenure density | 64.3% | 63.0% | 66.8% | 63.9% | 61.8% | 61.0% | 58.5% | 56.0% | 54.0% | 55.4% | |
| Channel Islands | Tenure-track | 77.0 | 83.5 | 81.0 | 78.3 | 79.5 | 85.0 | 94.0 | 105.5 | 113.0 | 125.4 |
| Lecturers | 103.4 | 104.0 | 105.4 | 107.2 | 118.7 | 144.7 | 155.4 | 168.0 | 176.1 | 189.7 | |
| Total | 180.4 | 187.5 | 186.4 | 185.5 | 198.2 | 229.7 | 249.4 | 273.5 | 289.1 | 315.1 | |
| Tenure density | 42.7% | 44.5% | 43.5% | 42.2% | 40.1% | 37.0% | 37.7% | 38.6% | 39.1% | 39.8% | |
| Chico | Tenure-track | 502.7 | 510.4 | 489.3 | 463.9 | 447.8 | 435.3 | 422.6 | 424.5 | 441.8 | 458.9 |
| Lecturers | 259.5 | 234.0 | 200.0 | 196.7 | 209.1 | 222.2 | 259.8 | 295.0 | 296.5 | 297.2 | |
| Total | 762.2 | 744.4 | 689.3 | 660.6 | 656.9 | 657.5 | 682.4 | 719.5 | 738.3 | 756.1 | |
| Tenure density | 66.0% | 68.6% | 71.0% | 70.2% | 68.2% | 66.2% | 61.9% | 59.0% | 59.8% | 60.7% | |
| Dominguez Hills | Tenure-track | 259.5 | 251.1 | 244.1 | 225.6 | 210.9 | 198.0 | 202.9 | 213.3 | 230.7 | 236.8 |
| Lecturers | 199.7 | 197.3 | 170.5 | 179.9 | 224.8 | 226.6 | 263.5 | 275.4 | 292.1 | 298.7 | |
| Total | 459.2 | 448.4 | 414.6 | 405.5 | 435.7 | 424.6 | 466.4 | 488.7 | 522.8 | 535.5 | |
| Tenure density | 56.5% | 56.0% | 58.9% | 55.6% | 48.4% | 46.6% | 43.5% | 43.6% | 44.1% | 44.2% | |
| East Bay | Tenure-track | 331.8 | 348.6 | 341.7 | 307.8 | 296.8 | 290.5 | 297.2 | 309.2 | 320.0 | 333.1 |
| Lecturers | 201.6 | 224.1 | 178.7 | 139.2 | 179.8 | 190.7 | 217.2 | 227.0 | 255.1 | 249.9 | |
| Total | 533.4 | 572.7 | 520.4 | 447.0 | 476.6 | 481.2 | 514.4 | 536.2 | 575.1 | 583.0 | |
| Tenure density | 62.2% | 60.9% | 65.7% | 68.9% | 62.3% | 60.4% | 57.8% | 57.7% | 55.6% | 57.1% | |
| Fresno | Tenure-track | 554.1 | 562.8 | 557.3 | 540.6 | 524.2 | 506.6 | 520.9 | 529.3 | 529.9 | 561.8 |
| Lecturers | 375.0 | 351.1 | 274.1 | 279.9 | 279.7 | 339.7 | 372.9 | 389.2 | 417.0 | 436.0 | |
| Total | 929.1 | 913.9 | 831.4 | 820.5 | 803.9 | 846.3 | 893.8 | 918.5 | 946.9 | 997.8 | |
| Tenure density | 59.6% | 61.6% | 67.0% | 65.9% | 65.2% | 59.9% | 58.3% | 57.6% | 56.0% | 56.3% | |
| Fullerton | Tenure-track | 712.0 | 710.6 | 729.6 | 712.5 | 715.6 | 722.3 | 728.3 | 746.3 | 779.1 | 803.3 |
| Lecturers | 616.1 | 547.7 | 427.0 | 472.8 | 550.1 | 602.3 | 613.2 | 669.3 | 665.2 | 663.9 | |
| Total | 1,328.1 | 1,258.3 | 1,156.6 | 1,185.3 | 1,265.7 | 1,324.6 | 1,341.5 | 1,415.6 | 1,444.3 | 1,467.2 | |
| Tenure density | 53.6% | 56.5% | 63.1% | 60.1% | 56.5% | 54.5% | 54.3% | 52.7% | 53.9% | 54.8% | |
| Humboldt | Tenure-track | 264.0 | 254.8 | 245.0 | 224.1 | 223.0 | 220.0 | 226.8 | 214.2 | 223.5 | 238.8 |
| Lecturers | 102.2 | 107.9 | 111.9 | 121.9 | 139.2 | 150.9 | 156.2 | 169.8 | 177.6 | 178.8 | |
| Total | 366.2 | 362.7 | 356.9 | 346.0 | 362.2 | 370.9 | 383.0 | 384.0 | 401.1 | 417.6 | |
| Tenure density | 72.1% | 70.3% | 68.6% | 64.8% | 61.6% | 59.3% | 59.2% | 55.8% | 55.7% | 57.2% | |
| Long Beach | Tenure-track | 832.8 | 825.7 | 832.0 | 794.9 | 777.8 | 769.7 | 759.2 | 773.4 | 772.0 | 803.3 |
| Lecturers | 603.0 | 626.9 | 529.1 | 504.2 | 576.3 | 542.4 | 582.8 | 655.1 | 697.4 | 714.7 | |
| Total | 1,435.8 | 1,452.6 | 1,361.1 | 1,299.1 | 1,354.1 | 1,312.1 | 1,342.0 | 1,428.5 | 1,469.4 | 1,518.0 | |
| Tenure density | 58.0% | 56.8% | 61.1% | 61.2% | 57.4% | 58.7% | 56.6% | 54.1% | 52.5% | 52.9% | |
| Los Angeles | Tenure-track | 515.3 | 517.3 | 541.2 | 521.9 | 513.5 | 505.2 | 491.7 | 491.2 | 502.3 | 514.4 |
| Lecturers | 315.0 | 316.0 | 219.0 | 235.9 | 272.1 | 284.3 | 332.5 | 422.6 | 502.9 | 576.1 | |
| Total | 830.3 | 833.3 | 760.2 | 757.8 | 785.6 | 789.5 | 824.2 | 913.8 | 1,005.2 | 1,090.5 | |
| Tenure density | 62.1% | 62.1% | 71.2% | 68.9% | 65.4% | 64.0% | 59.7% | 53.8% | 50.0% | 47.2% | |
| Maritime | Tenure-track | 41.2 | 40.6 | 44.0 | 46.1 | 42.7 | 44.3 | 48.6 | 50.8 | 50.9 | 51.1 |
| Lecturers | 23.6 | 23.3 | 20.6 | 19.7 | 20.6 | 20.2 | 25.3 | 27.6 | 27.3 | 27.1 | |
| Total | 64.8 | 63.9 | 64.6 | 65.8 | 63.3 | 64.5 | 73.9 | 78.4 | 78.2 | 78.2 | |
| Tenure density | 63.6% | 63.5% | 68.1% | 70.1% | 67.5% | 68.7% | 65.8% | 64.8% | 65.1% | 65.3% | |
| Monterey Bay | Tenure-track | 103.1 | 107.2 | 111.1 | 113.3 | 119.1 | 117.8 | 114.3 | 117.0 | 148.5 | 152.7 |
| Lecturers | 104.1 | 97.4 | 92.5 | 117.9 | 120.9 | 141.0 | 155.5 | 186.5 | 187.1 | 193.1 | |
| Total | 207.2 | 204.6 | 203.6 | 231.2 | 240.0 | 258.8 | 269.8 | 303.5 | 335.6 | 345.8 | |
| Tenure density | 49.8% | 52.4% | 54.6% | 49.0% | 49.6% | 45.5% | 42.4% | 38.6% | 44.2% | 44.2% | |
| Northridge | Tenure-track | 734.7 | 745.1 | 720.4 | 690.7 | 751.1 | 776.9 | 767.8 | 760.3 | 801.3 | 793.4 |
| Lecturers | 493.8 | 511.0 | 479.5 | 478.0 | 494.8 | 506.3 | 574.4 | 619.6 | 641.8 | 643.9 | |
| Total | 1,228.5 | 1,256.1 | 1,199.9 | 1,168.7 | 1,245.9 | 1,283.2 | 1,342.2 | 1,379.9 | 1,443.1 | 1,437.3 | |
| Tenure density | 59.8% | 59.3% | 60.0% | 59.1% | 60.3% | 60.5% | 57.2% | 55.1% | 55.5% | 55.2% | |
| Pomona | Tenure-track | 553.2 | 531.6 | 519.4 | 476.8 | 474.3 | 490.5 | 478.2 | 502.9 | 508.1 | 535.0 |
| Lecturers | 322.1 | 254.2 | 255.9 | 248.2 | 283.7 | 292.5 | 319.5 | 361.0 | 393.5 | 393.0 | |
| Total | 875.3 | 785.8 | 775.3 | 725.0 | 758.0 | 783.0 | 797.7 | 863.9 | 901.6 | 928.0 | |
| Tenure density | 63.2% | 67.7% | 67.0% | 65.8% | 62.6% | 62.6% | 59.9% | 58.2% | 56.4% | 57.7% | |
| Sacramento | Tenure-track | 714.3 | 712.1 | 711.3 | 665.2 | 631.4 | 598.1 | 592.4 | 614.3 | 613.2 | 626.5 |
| Lecturers | 369.2 | 329.4 | 301.7 | 245.7 | 298.8 | 309.9 | 356.1 | 384.6 | 417.9 | 463.9 | |
| Total | 1,083.5 | 1,041.5 | 1,013.0 | 910.9 | 930.2 | 908.0 | 948.5 | 998.9 | 1,031.1 | 1,090.4 | |
| Tenure density | 65.9% | 68.4% | 70.2% | 73.0% | 67.9% | 65.9% | 62.5% | 61.5% | 59.5% | 57.5% | |
| San Bernardino | Tenure-track | 392.7 | 400.8 | 397.1 | 374.0 | 373.7 | 372.7 | 380.5 | 387.1 | 384.0 | 403.7 |
| Lecturers | 248.6 | 262.5 | 205.4 | 210.7 | 208.2 | 239.5 | 249.2 | 256.4 | 301.5 | 289.8 | |
| Total | 641.3 | 663.3 | 602.5 | 584.7 | 581.9 | 612.2 | 629.7 | 643.5 | 685.5 | 693.5 | |
| Tenure density | 61.2% | 60.4% | 65.9% | 64.0% | 64.2% | 60.9% | 60.4% | 60.2% | 56.0% | 58.2% | |
| San Diego | Tenure-track | 813.5 | 799.6 | 782.8 | 735.5 | 742.7 | 706.0 | 690.2 | 694.0 | 703.1 | 720.5 |
| Lecturers | 475.3 | 468.6 | 357.4 | 348.3 | 336.5 | 324.3 | 371.3 | 422.3 | 443.6 | 448.2 | |
| Total | 1,288.8 | 1,268.2 | 1,140.2 | 1,083.8 | 1,079.2 | 1,030.3 | 1,061.5 | 1,116.3 | 1,146.7 | 1,168.7 | |
| Tenure density | 63.1% | 63.0% | 68.7% | 67.9% | 68.8% | 68.5% | 65.0% | 62.2% | 61.3% | 61.6% | |
| San Francisco | Tenure-track | 777.4 | 791.1 | 784.7 | 746.3 | 731.2 | 715.8 | 726.6 | 720.9 | 719.0 | 743.3 |
| Lecturers | 383.7 | 340.9 | 269.8 | 324.1 | 348.2 | 398.0 | 414.5 | 412.4 | 422.6 | 437.5 | |
| Total | 1,161.1 | 1,132.0 | 1,054.5 | 1,070.4 | 1,079.4 | 1,113.8 | 1,141.1 | 1,133.3 | 1,141.6 | 1,180.8 | |
| Tenure density | 67.0% | 69.9% | 74.4% | 69.7% | 67.7% | 64.3% | 63.7% | 63.6% | 63.0% | 62.9% | |
| San Jose | Tenure-track | 686.5 | 689.4 | 692.0 | 649.6 | 635.3 | 640.8 | 640.5 | 626.9 | 645.0 | 674.3 |
| Lecturers | 524.2 | 541.2 | 449.1 | 448.2 | 549.9 | 515.0 | 522.3 | 547.3 | 545.7 | 555.6 | |
| Total | 1,210.7 | 1,230.6 | 1,141.1 | 1,097.8 | 1,185.2 | 1,155.8 | 1,162.8 | 1,174.2 | 1,190.7 | 1,229.9 | |
| Tenure density | 56.7% | 56.0% | 60.6% | 59.2% | 53.6% | 55.4% | 55.1% | 53.4% | 54.2% | 54.8% | |
| San Luis Obispo | Tenure-track | 643.0 | 670.8 | 671.2 | 635.7 | 630.5 | 631.1 | 623.6 | 635.4 | 654.5 | 666.9 |
| Lecturers | 275.6 | 265.9 | 236.2 | 243.5 | 262.8 | 254.9 | 288.3 | 315.2 | 345.6 | 366.0 | |
| Total | 918.6 | 936.7 | 907.4 | 879.2 | 893.3 | 886.0 | 911.9 | 950.6 | 1,000.1 | 1,032.9 | |
| Tenure density | 70.0% | 71.6% | 74.0% | 72.3% | 70.6% | 71.2% | 68.4% | 66.8% | 65.4% | 64.6% | |
| San Marcos | Tenure-track | 219.3 | 222.2 | 217.0 | 212.9 | 232.2 | 229.0 | 229.8 | 239.5 | 251.6 | 262.9 |
| Lecturers | 130.3 | 120.4 | 132.0 | 141.4 | 170.4 | 181.7 | 203.9 | 223.0 | 248.0 | 253.3 | |
| Total | 349.6 | 342.6 | 349.0 | 354.3 | 402.6 | 410.7 | 433.7 | 462.5 | 499.6 | 516.2 | |
| Tenure density | 62.7% | 64.9% | 62.2% | 60.1% | 57.7% | 55.8% | 53.0% | 51.8% | 50.4% | 50.9% | |
| Sonoma | Tenure-track | 256.7 | 258.7 | 261.9 | 243.8 | 244.8 | 234.2 | 220.5 | 217.5 | 224.8 | 232.8 |
| Lecturers | 121.9 | 130.8 | 97.2 | 113.1 | 101.9 | 114.0 | 133.1 | 147.1 | 147.3 | 153.7 | |
| Total | 378.6 | 389.5 | 359.1 | 356.9 | 346.7 | 348.2 | 353.6 | 364.6 | 372.1 | 386.5 | |
| Tenure density | 67.8% | 66.4% | 72.9% | 68.3% | 70.6% | 67.3% | 62.4% | 59.7% | 60.4% | 60.2% | |
| Stanislaus | Tenure-track | 255.5 | 261.5 | 253.8 | 232.9 | 237.4 | 232.3 | 232.5 | 242.3 | 240.6 | 254.7 |
| Lecturers | 143.4 | 132.2 | 74.6 | 97.2 | 100.8 | 110.5 | 127.3 | 142.9 | 149.7 | 164.7 | |
| Total | 398.9 | 393.7 | 328.4 | 330.1 | 338.2 | 342.8 | 359.8 | 385.2 | 390.3 | 419.4 | |
| Tenure density | 64.1% | 66.4% | 77.3% | 70.6% | 70.2% | 67.8% | 64.6% | 62.9% | 61.6% | 60.7% | |
| Systemwide | Tenure-track | 10,459.9 | 10,497.7 | 10,425.5 | 9,874.3 | 9,813.0 | 9,702.7 | 9,669.0 | 9,796.9 | 10,042.9 | 10,394.3 |
| Lecturers | 6,513.3 | 6,305.5 | 5,286.0 | 5,376.1 | 5,957.1 | 6,227.0 | 6,821.7 | 7,459.4 | 7,909.9 | 8,156.6 | |
| Total | 16,973.2 | 16,803.2 | 15,711.5 | 15,250.4 | 15,770.1 | 15,929.7 | 16,490.7 | 17,256.3 | 17,952.8 | 18,550.9 | |
| Tenure density | 61.6% | 62.5% | 66.4% | 64.7% | 62.2% | 60.9% | 58.6% | 56.8% | 55.9% | 56.0% | |
FTE as of October 31 each year
Tenure density defined as tenure-track FTE divided by total instructional FTE
Includes instructional faculty; excludes coaches, counselors, and librarians
Includes active faculty; excludes leave without pay
Tenure status based on class code
Source data: CIRS AN file
Academic Human Resources
CSU Office of the Chancellor, May 2017
Systemwide Trends
Faculty FTE, Headcounts, and Tenure Density
Systemwide Summary
| Systemwide Summary | Tenure Status | Fall Instructional Faculty Full-time Equivalents (FTE) | |||||||||
|---|---|---|---|---|---|---|---|---|---|---|---|
| Tenure-track | 10,459.9 | 10,497.7 | 10,425.5 | 9,874.3 | 9,813.0 | 9,702.7 | 9,669.0 | 9,796.9 | 10,042.9 | 10,394.3 | |
| Lecturers | 6,513.3 | 6,305.5 | 5,286.0 | 5,376.1 | 5,957.1 | 6,227.0 | 6,821.7 | 7,459.4 | 7,909.9 | 8,156.6 | |
| Total | 16,973.2 | 16,803.2 | 15,711.5 | 15,250.4 | 15,770.1 | 15,929.7 | 16,490.7 | 17,256.3 | 17,952.8 | 18,550.9 | |
| Tenure density | 61.6% | 62.5% | 66.4% | 64.7% | 62.2% | 60.9% | 58.6% | 56.8% | 55.9% | 56.0% | |
| Systemwide Summary | Tenure Status | Fall Instructional Faculty Headcounts | |||||||||
|---|---|---|---|---|---|---|---|---|---|---|---|
| Tenure-track | 10,763 | 10,776 | 10,688 | 10,138 | 10,079 | 9,981 | 9,961 | 10,102 | 10,314 | 10,653 | |
| Lecturers | 13,303 | 12,805 | 10,696 | 10,790 | 11,831 | 12,233 | 13,146 | 14,263 | 14,994 | 15,571 | |
| Total | 24,066 | 23,581 | 21,384 | 20,928 | 21,910 | 22,214 | 23,107 | 24,365 | 25,308 | 26,224 | |
FTE and Headcounts as of October 31 each year
Tenure density defined as tenure-track FTE divided by total instructional FTE
Includes instructional faculty; excludes coaches, counselors, and librarians
Includes active faculty; excludes leave without pay
Tenure status based on class code Source data: CIRS AN file
Academic Human Resources
CSU Office of the Chancellor, May 2017
Attachment 4
| 1988 | 1989 | 1990 | 1991 | 1992 | 1993 | 1994 | 1995 | 1996 | 1997 | 1998 | 1999 | 2000 | 2001 | 2002 | |
|---|---|---|---|---|---|---|---|---|---|---|---|---|---|---|---|
| 70 + | 68 | 56 | 65 | 57 | 42 | 46 | 54 | 60 | 69 | 76 | 85 | 106 | 103 | 112 | 119 |
| 60 - 69 | 1,417 | 1,551 | 1,585 | 1,419 | 1,041 | 1,199 | 1,263 | 1,403 | 1,514 | 1,627 | 1,657 | 1,842 | 1,849 | 1,871 | 2,028 |
| 50 - 59 | 3,741 | 3,898 | 4,078 | 4,133 | 4,156 | 4,315 | 4,356 | 4,366 | 4,461 | 4,469 | 4,493 | 4,521 | 4,458 | 4,426 | 4,379 |
| 40 - 49 | 4,558 | 4,644 | 4,633 | 4,347 | 4,059 | 3,808 | 3,499 | 3,447 | 3,334 | 3,135 | 3,028 | 2,961 | 2,976 | 3,054 | 3,125 |
| 30 - 39 | 2,004 | 1,951 | 1,972 | 1,763 | 1,493 | 1,331 | 1,226 | 1,155 | 1,153 | 1,185 | 1,287 | 1,411 | 1,571 | 1,769 | 1,969 |
| Under 30 | 120 | 130 | 123 | 101 | 67 | 60 | 61 | 72 | 94 | 89 | 91 | 95 | 132 | 147 | 162 |
| Total | 11,908 | 12,230 | 12,456 | 11,820 | 10,858 | 10,759 | 10,459 | 10,503 | 10,625 | 10,581 | 10,641 | 10,936 | 11,089 | 11,379 | 11,782 |
| Average Age | 48.8 | 49.1 | 49.2 | 49.4 | 49.3 | 49.9 | 50.4 | 50.7 | 51 | 51.2 | 51.1 | 51.3 | 51 | 50.6 | 50.4 |
| 2003 | 149 | 137 | 152 | 132 | 162 | 176 | 212 | 204 | 219 | 268 | 298 | 332 | 333 | 350 | |
| 60 - 69 | 1,987 | 1,865 | 1,900 | 1,949 | 2,112 | 2,209 | 2,312 | 2,302 | 2,361 | 2,393 | 2,408 | 2,437 | 2,517 | 2,543 | |
| 50 - 59 | 4,241 | 4,039 | 4,102 | 4,103 | 4,086 | 3,915 | 3,714 | 3,552 | 3,524 | 3,474 | 3,396 | 3,348 | 3,320 | 3,301 | |
| 40 - 49 | 3,109 | 2,985 | 2,932 | 3,008 | 3,105 | 3,142 | 3,157 | 3,193 | 3,292 | 3,320 | 3,414 | 3,497 | 3,603 | 3,727 | |
| 30 - 39 | 2,060 | 1,942 | 2,084 | 2,287 | 2,422 | 2,428 | 2,217 | 1,911 | 1,866 | 1,777 | 1,815 | 2,011 | 2,303 | 2,598 | |
| Under 30 | 128 | 101 | 106 | 143 | 176 | 149 | 100 | 66 | 68 | 81 | 117 | 165 | 190 | 210 | |
| Total | 11,674 | 11,069 | 11,276 | 11,622 | 12,063 | 12,019 | 11,712 | 11,228 | 11,330 | 11,313 | 11,448 | 11,790 | 12,266 | 12,729 | |
| Average Age | 50.3 | 50.3 | 50.3 | 50.0 | 50.0 | 50.1 | 50.5 | 51.0 | 51.0 | 51.2 | 51.1 | 50.8 | 50.3 | 50.0 |
0%
10%
20%
30%
40%
50%
60%
70%
80%
90%
100%
1988 1990 1992 1994 1996 1998 2000 2002 2004 2006 2008 2010 2012 2014 2016
Age Distribution of CSU Full-Time Faculty (Percent by Age Group)
60+
50-59
40-49
Under 40
Attachment 5
Separations among CSU Tenure-track Faculty
0
100
200
300
400
500
600
700
800
900
1000
94-95 95-96 96-97 97-98 98-99 99-00 00-01 01-02 02-03 03-04 04-05 05-06 06-07 07-08
08-09 09-10 10-11 11-12 12-13 13-14 14-15 15-16
Retirements Other Separations
1994-95 1995-96 1996-97 1997-98 1998-99 1999-00 2000-01 2001-02 2002-03 2003-04 2004-05
2005-06 2006-07
Retirements 166 263 369 504 286 637 695 417 495 702 437 328 271
Other Separations 137 162 144 135 143 158 188 183 190 196 231 270 284
Total Separations 303 425 513 639 429 795 883 600 685 898 668 598 555
Retirements as a % of Separations 55% 62% 72% 79% 67% 80% 79% 70% 72% 78% 65% 55%
49%
2007-08 2008-09 2009-10 2010-11 2011-12 2012-13 2013-14 2014-15 2015-16 22 year Total
Retirements 300 281 476 309 343 352 351 355 317 8,654
Other Separations 201 197 199 200 200 208 228 187 286 4,327
Total Separations 501 478 675 509 543 560 579 542 603 12,981
Retirements as a % of Separations 60% 59% 71% 61% 63% 63% 61% 65.5% 52.6% 66.7%
Note: Faculty retirements have fluctuated widely related to the impact of “Golden Handshakes” boosting retirements one year and reducing their numbers in subsequent years. In 1998-99, retirements may have been fewer as passage of SB 400 provided improved benefits to those retiring after the academic year ended.
CSU Tenure-track Faculty Retirement and FERP
Head Count since 1996-97
0
100
200
300
400
500
600
700
800
96-97 97-98 98-99 99-00 00-01 01-02 02-03 03-04 04-05 05-06 06-07 07-08 08-09 09-10
10-11 11-12 12-13 13-14 14-15 15-16
FERPs Other Retirements
1996-97 1997-98 1998-99 1999-00 2000-01 2001-02 2002-03 2003-04 2004-05 2005-06 2006-07
FERPs 182 311 119 332 470 261 357 270 340 201 110
Other Retirements 187 193 167 305 225 156 138 432 97 127 161
Total Retirements 369 504 286 637 695 417 495 702 437 328 271
FERPs as % of Total Retirements 49% 62% 42% 52% 68% 63% 72% 38% 78% 61% 41%
2007-08 2008-09 2009-10 2010-11 2011-12 2012-13 2013-14 2014-15 2015-16
FERPs 156 179 346 208 212 235 228 224 146
Other Retirements 144 102 130 101 131 117 123 131 171
Total Retirements 300 281 476 309 343 352 351 355 317
FERPs as % of Total Retirements 52% 64% 73% 67% 62% 67% 65% 63% 46%
This HTML version was generated with AI assistance and may contain errors or omissions. The original approved PDF remains the official document of record. An alternative accessible format is available upon request from the document creator in accordance with Title II of the ADA.