Visuals in Major Applications: Why, with Samples
Office of University Initiatives
Gil Harootunian, PhD, Executive Director
Information-Dense Visuals:
University Initiatives uses these in applications that have resulted in close to $50M total awards, including the recent $8M START educational research award from the USDE Office of Postsecondary Student Success Grant Program (PSSGP)

Visuals: Why
Major applications present condensed and complex material. Visuals -
1. Increase clarity of presentation.
2. Make economical use of precious space.
3. Are understandable to program officers and reviewers who are highly advanced readers.

Types of Visuals
1. Showcase ’pretty’ graphs from external sources
2. Demonstrate research is aligned w/ program design
3. Map implementation (management, milestones, timeline)
4. Present evaluation plan (from data and methods to inputs and outcomes)
5. Analyze allocations (effort, budget)
6. Document meaningful comparisons (e.g., Valley vs. coastal California)

Pretty Graphs from External Sources: High Value (...but not mainstay)
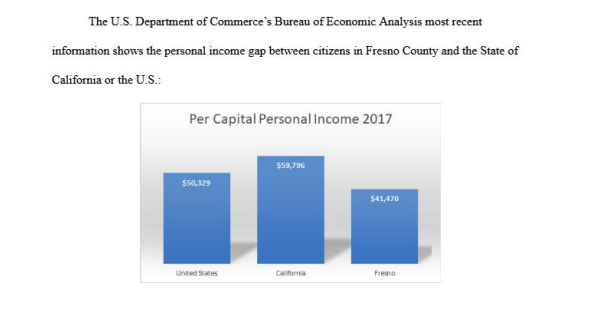
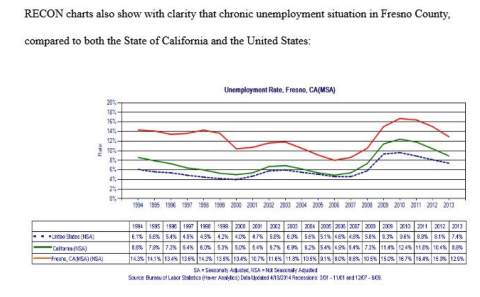
Mainstay Visuals
These present material that is integral to your application. These visuals tend to be high impact information, and each is adapted to the major application under development.
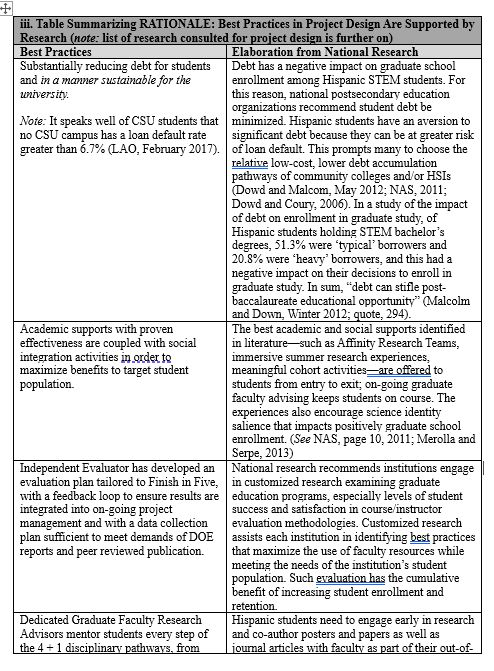
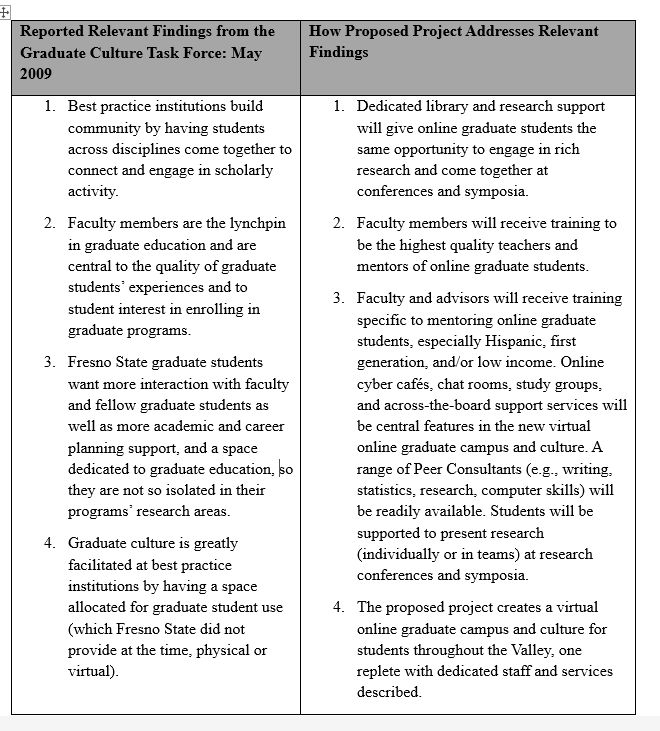
Research Sources Aligned w/ Program Design: Two Samples of Tables Adapted for Individual Major Applications
Left Column: Best practices to support graduate students.
Right Column: Discussion of national research recommendations and evidence
Left Column: Findings from Graduate Culture Task Force
Right Column: Program Components corresponding to each finding in the Graduate Culture Task Force report.
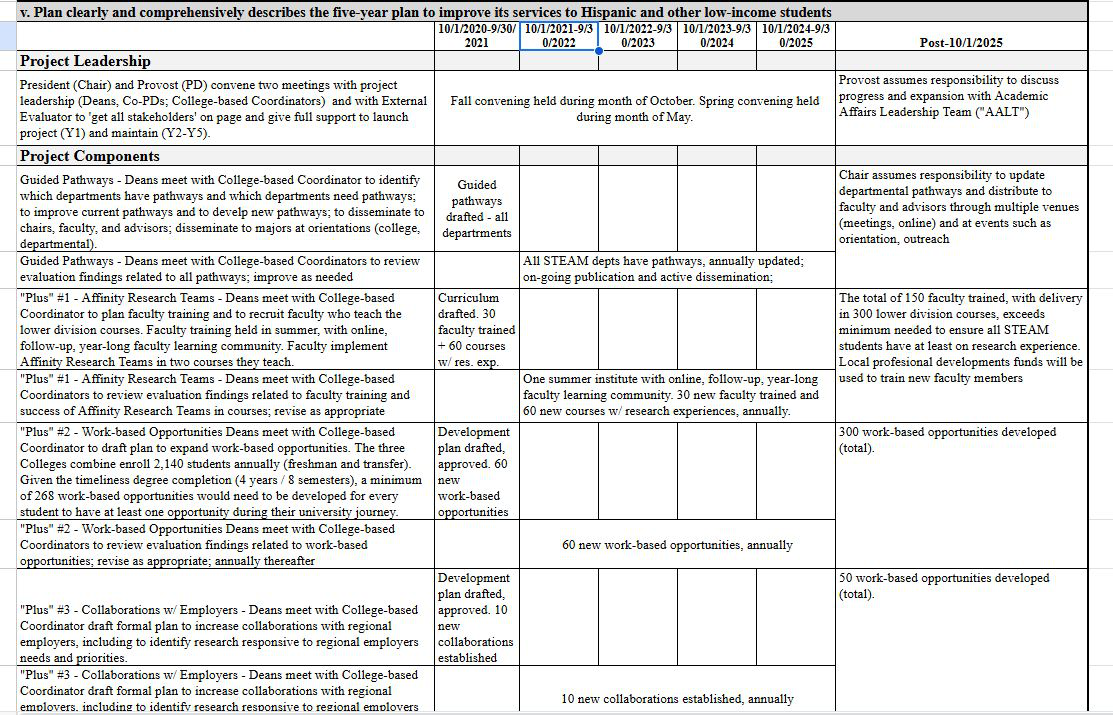
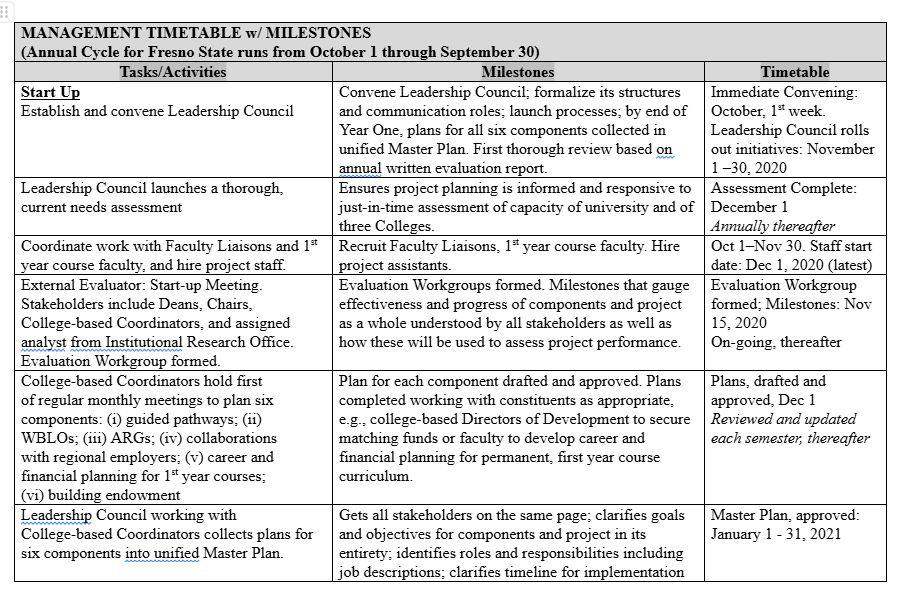
Implementation (Management, Milestones, and Timelines): Two Samples of Tables Adapted for Individual Major Applications
Each program component is broken out, w/ quantifiable outcomes such as “60 new work-based opportunities annually”
Each key task has a milestone with a specific date to achieve
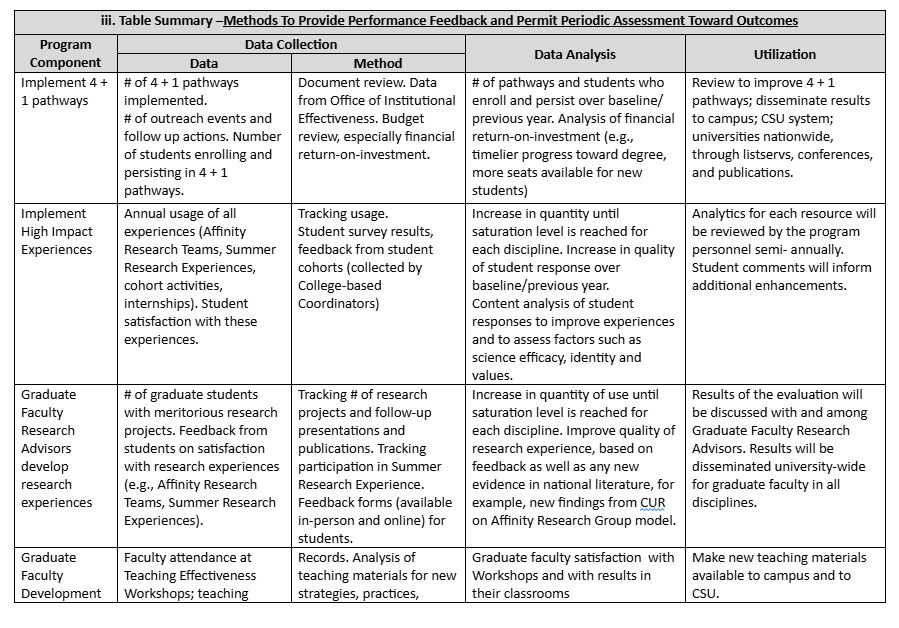
Evaluation (from data and methods to inputs and outcomes): Three Samples of Tables Adapted for Individual Major Applications
Each key program component has data and method specified, along with analysis and utilization by CSU, Fresno
Note: For a five-year project, sponsors will want to see three outcomes: short-term, mid-term, and long-term
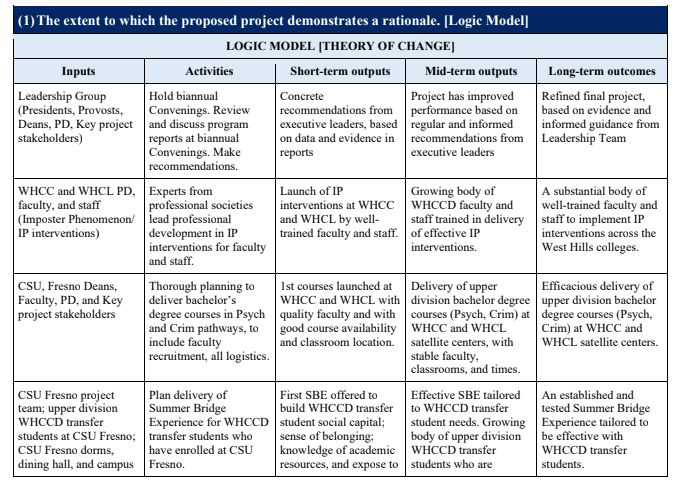
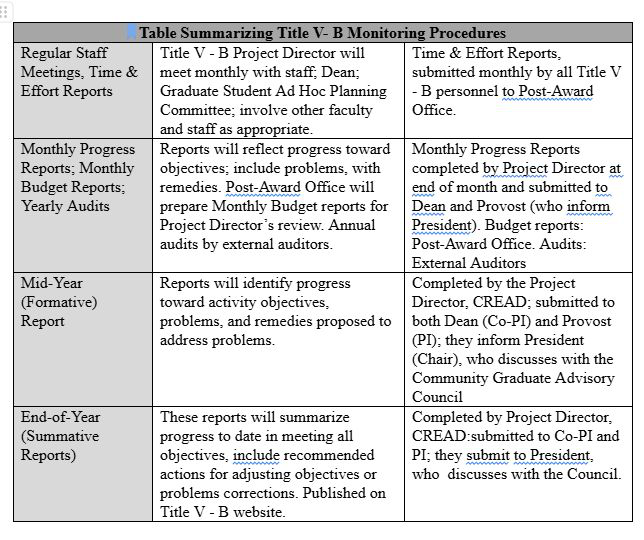
Who does what and when to assure sponsors that program supported by taxpayer dollars is being implemented with care.
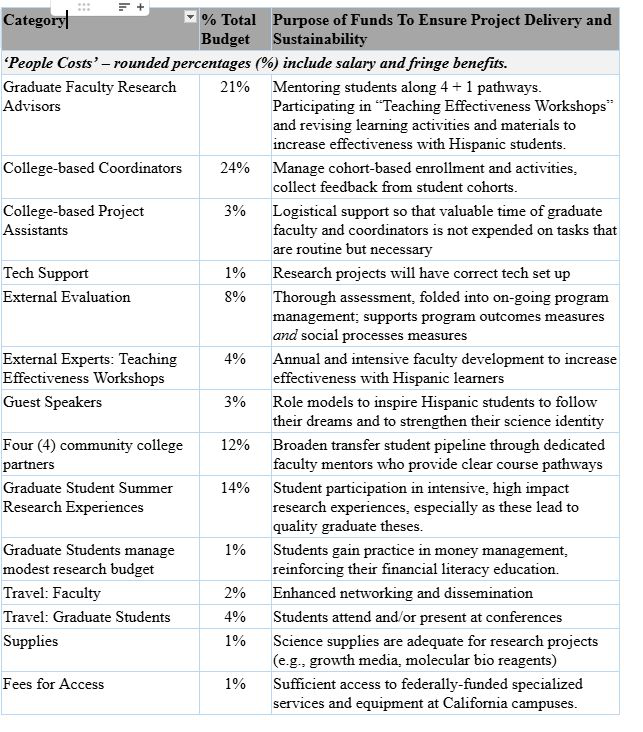
Allocations:Effort and Budget- Three Samples of Tables Adapted for Individual Major Applications
Allocation is clarified for each budget line item with explanation of its purpose.
Charts shows well planned allocation of scholarships with detail (above + below)
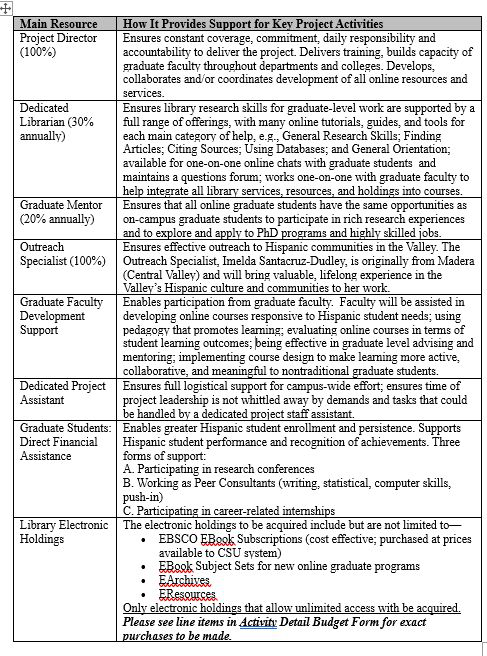
Left column: Detail on allocation of Key Personnel.
Right column: Justification for that allocation.
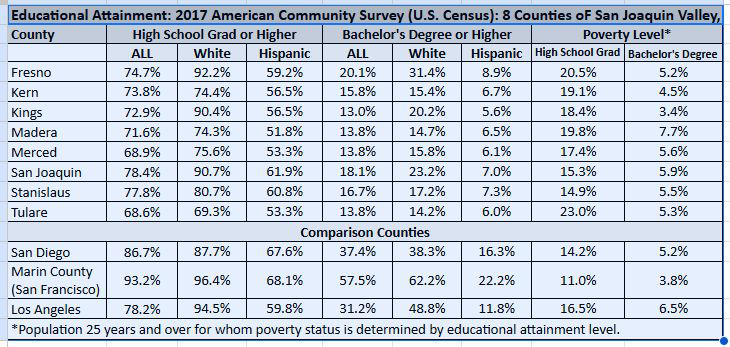
Don’t forget comparisons: Program Officers and Reviewers may never have been to California or only think of coastal California (LA, Bay Area, etc.)
Three bottom rows: San Diego, San Francisco, and Los Angeles data clarifies the difference with 8 counties of San Joaquin Valley
Contact anytime:
Dr. Gil Harootunian, Executive Director, University Initiatives
gharootunian@csufresno.edu
278-4850
This PDF is provided as a print-only reference document and may not be fully accessible to users of assistive technology. For more information, please visit Title II Rule on Digital Accessibility page.